Efficacy and effectiveness: how to read a vaccine study




Table of contents
- Efficacy and effectiveness: two different questions
- How the clinical trial measures efficacy
- From trial to real world: effectiveness
- The test-negative design
- Other field designs: screening and outbreak
- Relative reduction, absolute reduction and NNV
- In practice: a guide to reading a vaccine study
- How NEXO helps train this reasoning
- Frequently asked questions
- Take-home messages
- References
Every news story about a vaccine brings a protection number. Sometimes it comes from a clinical trial with tens of thousands of randomly assigned volunteers; sometimes from health records of millions of people vaccinated in routine care. The two numbers answer different questions and go wrong for different reasons. Reading a vaccine study starts with knowing which question it asks.
The World Health Organization (WHO) separates the two situations in its guidance: clinical evaluation before registration, with rules for trials (WHO, 2017), and effectiveness evaluation after introduction, with observational designs (WHO, 2017; WHO, 2021). This text follows that division.
The roadmap covers efficacy in the trial, effectiveness in the real world, healthy vaccinee bias, the test-negative design, rapid field methods, and the difference between relative reduction, absolute reduction and number needed to vaccinate (NNV).
Key points
- Efficacy is the protection measured in a randomized trial; effectiveness is the protection observed in routine use (WHO, 2021).
- In an RNA vaccine trial against covid-19, covid-19 was confirmed in 8 vaccinated participants and in 162 placebo-group participants, an efficacy of 95 in every 100 (Polack, 2020).
- An effectiveness study with almost 600 thousand people per group found protection similar to that of the trial (Dagan, 2021).
- Observational studies can find protection where it is impossible, such as before the influenza season, because of healthy vaccinee bias (Lipsitch, 2016).
- The test-negative design reduces confounding by healthcare-seeking behavior, in exchange for its own assumptions (WHO, 2017; Lewnard, 2018).
- The same relative reduction can mean very different NNVs, depending on baseline risk (Olliaro, 2021).
Summary
- Efficacy and effectiveness: two different questions
- How the clinical trial measures efficacy
- From trial to real world: effectiveness
- The test-negative design
- Other field designs: screening and outbreak
- Relative reduction, absolute reduction and NNV
- In practice: a roadmap for reading a vaccine study
- How NEXO helps train this reasoning
- Frequently asked questions
- Take-home messages
Efficacy and effectiveness: two different questions
Efficacy is how much the vaccine protects under controlled conditions: participants chosen by defined criteria, randomization between vaccine and placebo, schedule applied at the right interval, active surveillance and laboratory confirmation of cases. Effectiveness is how much it protects in routine use, with people of all ages and diseases, delays in the schedule, real transport and storage, and viruses that change over time (WHO, 2021).
The basic calculation is the same in both cases. Protection is one minus the relative risk: if vaccinated people fall ill with one fifth of the risk of unvaccinated people, the vaccine prevented 4 of every 5 illnesses that would have occurred. What changes is how each design estimates that relative risk and which biases enter the estimate. Both designs use this logic: the trial compares attack rates between the randomized groups (Orenstein, 1985), and the records cohort estimates effectiveness as one minus the hazard ratio (Dagan, 2021).
Direct, indirect effect and program impact
A vaccine acts at more than one level. The direct effect is the protection of those who received the vaccine, compared with those who did not. The indirect effect is the protection of those who went unvaccinated because circulation of the agent fell around them. The overall effect of a program adds the two, and time-series studies, often dismissed as "ecological", are the only observational design capable of measuring it (Lipsitch, 2016).
WHO therefore separates effectiveness studies from impact studies, which look at the disease burden in the population after vaccine introduction (WHO, 2021). Readers need to know whether the number speaks of the vaccinated individual or of the entire population.
How the clinical trial measures efficacy
The randomized trial is the standard for registering a vaccine. WHO gathers in a guide what regulatory authorities expect from the clinical evaluation of vaccines, with chapters on immunogenicity, efficacy and safety and with the requirement that cases meet a definition set out in the protocol (WHO, 2017). Randomization balances, on average, everything that can influence risk, including what no one measured. That is why the comparison is fair, as we discussed in randomized trials.
When reading the methods section of a vaccine trial, four definitions weigh most. The first is the primary endpoint, which can be infection, symptomatic disease, hospitalization or death, and each choice gives a different number. The second is case confirmation, with symptoms and a laboratory test, to avoid counting other diseases. The third is the counting window, that is, from how many days after the last dose cases enter the analysis. The fourth is the analysis population: everyone randomized or only those who completed the schedule as per protocol. Olliaro and colleagues show that the trials of the first covid-19 vaccines differed precisely on these points, which makes them hard to compare with each other (Olliaro, 2021).
An example: the RNA vaccine trial against covid-19
In the trial that led to the registration of the first messenger RNA vaccine, 43,548 participants were randomized to vaccine or placebo. From 7 days after the second dose, covid-19 was confirmed in 8 vaccinated participants and in 162 participants in the placebo group, an estimated efficacy of 95 in 100, with a credible interval of 90.3 to 97.6 (Polack, 2020). Of the 10 severe cases after the first dose, 9 occurred in the placebo group (Polack, 2020).
The same article shows the limits of the design. The median safety follow-up was 2 months (Polack, 2020). WHO notes that most of these trials used symptomatic covid-19 as the primary endpoint, that many participants in the placebo group would receive the vaccine before the end of the study and that questions such as protection against severe disease and death and the duration of protection would be left to effectiveness studies (WHO, 2021). Rare adverse events call for other designs, such as the self-controlled case series.
What efficacy still leaves open
The trial measures the direct effect in those who took part, under controlled conditions. WHO lists what only evaluation after introduction answers: performance with a real cold chain, with delayed or incomplete schedules, in the general population, including groups excluded from the trials, and against different variants (WHO, 2021).
From trial to real world: effectiveness
In routine practice, no one randomizes who gets vaccinated. Effectiveness studies compare vaccinated and unvaccinated people who reached that state by choice, access or indication, and every difference between the groups that influences risk contaminates the estimate. The critical reading of observational studies applies here in full.
An example of a matched cohort
Soon after the start of covid-19 vaccination in Israel, a study used the records of a large health organization and matched each vaccinated person to an unvaccinated person with similar characteristics, forming two groups of 596,618 people. From 7 days after the second dose, the estimated effectiveness was 92 in 100 against documented infection, 94 against symptomatic disease, 87 against hospitalization and 92 against severe disease (Dagan, 2021). The authors concluded that the result was compatible with that of the trial (Dagan, 2021).
The authors declared they had designed the study to emulate a target trial (Dagan, 2021). Hernán and Robins propose exactly this: write the protocol of the trial you would like to conduct, with eligibility criteria, compared strategies, form of allocation, follow-up period, outcome, causal contrast and analysis strategy, and then use the data to imitate it (Hernán and Robins, 2016). The choice of time zero for follow-up receives special attention, because errors at this point create common biases (Hernán and Robins, 2016).
The healthy vaccinee bias
People who seek the vaccine tend to take better care of their health, have more access to services and, among older adults, be less frail. This makes the vaccinated group appear protected from outcomes the vaccine could not prevent, the so-called healthy vaccinee bias (WHO, 2017). The effect of the influenza vaccine on mortality should only appear during the season; any advantage for the vaccinated in the preceding months indicates bias (Lipsitch, 2016).
A study with older adults tested this idea by separating mortality before, during and after the season. The largest reduction appeared precisely before the virus circulation, and the usual statistical adjustments for health status actually increased the overestimate (Lipsitch, 2016). Lipsitch and colleagues call this approach a negative control: measuring the association of the vaccine with something it cannot affect, or in a period when it cannot act (Lipsitch, 2016).
Besides the healthy vaccinee, WHO lists other important distortions in observational studies. One is confounding by health-care seeking and by exposure risk. Another is misclassification of the outcome due to diagnostic error. Prior infection and false inferences of waning protection complete the list (WHO, 2021). The reasoning of the negative control resembles that of the comparison between observed and expected in pharmacovigilance.
The test-negative design
The test-negative design is increasingly used to estimate the annual effectiveness of the influenza vaccine (WHO, 2017), and WHO recommends it as the most efficient and feasible method to evaluate vaccines against covid-19 in low- and middle-income countries (WHO, 2021). The idea is simple: everyone who seeks care with an acute respiratory illness enters the study, and all of them take the laboratory test.
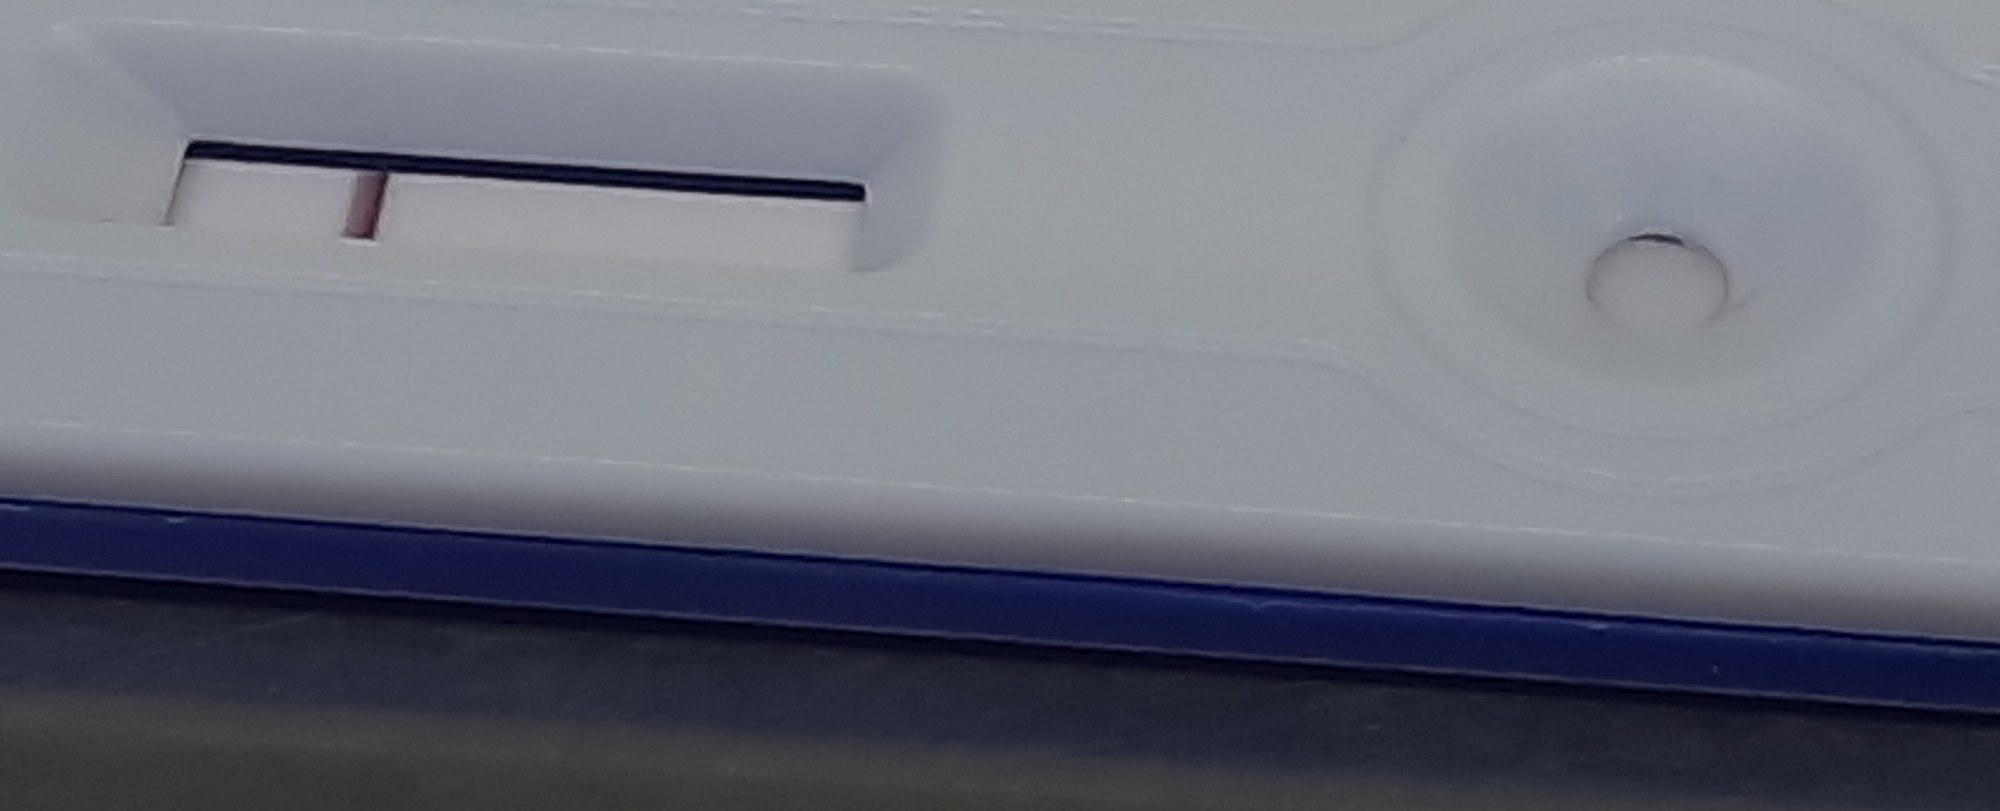
Those who test positive are cases; those who test negative are controls. Effectiveness is one minus the ratio between the odds of being vaccinated among cases and the odds of being vaccinated among controls (WHO, 2017). Because cases and controls sought the same service for the same type of symptom, they generally come from the same communities, and the difference in behavior between those who seek care and those who avoid it weighs less (WHO, 2017; Sullivan, 2016).
A hypothetical numerical example
Imagine 1,000 adults seen with influenza-like illness in one season. Of them, 200 test positive for influenza, and 40 of those were vaccinated, or 1 in 5. Of the 800 negative, 320 were vaccinated, or 2 in 5. The odds of vaccination among cases are 40 to 160, one quarter; among controls, 320 to 480, two thirds. The ratio between the two is 0.375, and the estimated effectiveness is close to 62 in 100, following the formula in the WHO guide (WHO, 2017).
The assumptions that support the design
The advantage comes with assumptions. For the estimate to be valid, one must accept (WHO, 2017; Lewnard, 2018):
- that the influenza vaccine protects only against influenza, without changing the other causes of respiratory illness that generate the controls;
- that the study is limited to the period of virus circulation and treats calendar time as a possible confounder;
- that entry and testing criteria are strict and the same for everyone;
- that the decision to get vaccinated is not linked to exposure or susceptibility.
Lewnard and colleagues showed that the odds ratio recovers the direct effect of the vaccine only under two conditions: vaccination decisions unrelated to exposure or susceptibility and all-or-nothing protection; outside these, the estimate is biased, and the design may fail to correct for health-care seeking if inclusion and testing criteria are loose (Lewnard, 2018). WHO adds that controls enrolled outside the season must be excluded from the analysis (WHO, 2017).
The test matters
Because everything depends on classifying cases and controls well, the quality of the test enters the calculation. The WHO guide shows that, with near-perfect specificity, as with PCR, even a sensitivity of 70 in 100 has a negligible impact on the estimate (WHO, 2017). Specificity weighs more: a false positive moves a control into the case group. Reasoning about pre-test probability helps show why the same test performs better at the peak of the season than in months of low circulation.
The guide also calls for caution with severe outcomes. In hospitals, chronic heart and lung diseases raise at the same time the chance of vaccination and of admission for respiratory symptoms, and entry criteria that are too broad fill the control group with patients having exacerbations of these diseases (WHO, 2017).
Other field designs: screening and outbreak
Before the large databases, surveillance teams already needed to know quickly whether a vaccine was working. An article published in the WHO bulletin in 1985 organized the available field methods: screening, outbreak investigation, secondary attack rate in households, coverage assessment and case-control (Orenstein, 1985).
The screening method
The screening method requires only two numbers: the proportion of cases that were vaccinated and the vaccination coverage in the population from which the cases came (Orenstein, 1985). Effectiveness is the difference between coverage and the proportion of vaccinated among the cases, divided by coverage multiplied by the proportion of unvaccinated among the cases (Orenstein, 1985).
A hypothetical example shows the logic. If 9 in 10 children in a region are vaccinated against measles and half of the cases occur in the vaccinated, the calculation gives an effectiveness close to 89 in 100 (Orenstein, 1985). The number surprises anyone who looks only at the proportion of cases among the vaccinated: with high coverage, even a very good vaccine leaves many cases among the vaccinated, because almost everyone is vaccinated. The base rate is the missing piece in this intuitive reading.
The method is fast but crude. Orenstein and colleagues warn that it indicates the need for a more careful assessment, without serving for precise estimates, and that effectiveness can be overestimated if coverage is overestimated, especially above 8 in 10 (Orenstein, 1985). The WHO guide adds that the method depends entirely on correct coverage data in the population from which the cases came and that adjusting for confounders requires coverage broken down by subgroup (WHO, 2017).
Outbreak investigation
In an outbreak, the team counts cases among the vaccinated and unvaccinated of a well-defined population, such as a school, and compares the attack rates. Orenstein and colleagues consider an outbreak in a defined setting, such as a village, town or school, probably the best situation for measuring protection, provided the attack rate is high and vaccination records are good (Orenstein, 1985). Coverage and vaccination status come from cards and records, and a faulty record distorts everything that follows.
Relative reduction, absolute reduction and NNV
Efficacy and effectiveness are relative reductions in risk. They say what fraction of expected cases the vaccine prevented, but not how many cases that represents. For that it is necessary to know the baseline risk, the same reasoning of relative effect and absolute effect used for any treatment.
The number needed to vaccinate is the inverse of the absolute reduction: how many people need to be vaccinated to prevent one additional case in the study period (Olliaro, 2021).
The covid-19 trials in absolute numbers
Olliaro and colleagues recalculated the trials of the first vaccines against covid-19. In the trial of the RNA vaccine, the risk of covid-19 in the placebo group was about 0.9 in 100 participants during the study period, and the NNV was 119 (Olliaro, 2021). In other trials, the NNV ranged from 78 to 108, with relative reductions between 67 and 95 in 100 (Olliaro, 2021).
The same article shows how the NNV depends on the setting. In one of the vaccines, the relative reduction stayed stable between 66 and 67 per 100, but the attack rate rose from 1.8 to 2.4 per 100, and the NNV fell from 84 to 64 (Olliaro, 2021). The vaccine was the same; what changed was the risk around it. The article does the same calculation for the Israel cohort: relative reduction of 94 per 100, almost the same as in the trial, but an NNV of 217, against 119 in the trial (Olliaro, 2021).
Why the NNV from a trial does not carry over
The NNV applies to the follow-up time, the population and the transmission in the study. A trial of a few months, done in a phase of moderate transmission, gives a high NNV that says nothing about a whole year of pandemic or about older adults at much higher risk. Olliaro and colleagues argue for reporting both measures, relative and absolute, to avoid biased readings in either direction (Olliaro, 2021). The committees that recommend vaccines make this bridge when they weigh the evidence through the evidence-to-decision framework.
In practice: a guide to reading a vaccine study
Each design has a question, a strength and a typical weakness. The table summarizes what the sources describe.
| Design | What it estimates | Main strength | Typical weakness | Source |
|---|---|---|---|---|
| Randomized trial | Direct efficacy | Randomization balances measured and unmeasured factors | Short follow-up, few severe cases | Polack, 2020 |
| Cohort with records | Direct effectiveness | Large number of people and severe outcomes | Healthy vaccinee bias | Dagan, 2021 |
| Test-negative | Direct effectiveness | Reduces confounding by care-seeking | Assumptions that are hard to test | WHO, 2017 |
| Screening method | Approximate effectiveness | Speed, little data | Sensitive to coverage error | Orenstein, 1985 |
| Program time series | Overall effect | Measures direct and indirect effects together | Trends unrelated to the vaccine | Lipsitch, 2016 |
| Target trial emulation | Effect of strategies | Makes time zero and criteria explicit | Depends on the quality of the records | Hernán and Robins, 2016 |
Questions to ask any study
When faced with a protection number, these questions help decide how much to trust it:
- What is the estimated effect: direct, indirect or program-level?
- What is the outcome, and how was the case confirmed?
- From when were cases counted after administration?
- How did the groups reach their vaccination status, and what was done against healthy vaccinee bias?
- Was there a negative control, such as a period without circulation of the agent?
- What is the baseline risk, and what are the absolute reduction and the NNV?
- Do results from different designs agree?
Agreement between different designs is one of the strongest signals. When the trial and the records cohort reach similar estimates, as with covid-19 (Dagan, 2021), it becomes less likely that a bias specific to one of the designs explains the result. The list of study designs and their weaknesses complements this guide.
From evidence to recommendation
The WHO guides for vaccine effectiveness studies of influenza and covid-19 provide standardized protocols, so that different countries measure the same thing in the same way and the results can be pooled (WHO, 2017; WHO, 2021). These estimates feed the WHO expert advisory group on immunization, SAGE, and then the national committees, as we explain in SAGE and the WHO global recommendations. Weighing expected benefits and harms is the same exercise as clinical decision-making, now at population scale.
How NEXO helps train this reasoning
In NEXO, the case of the day is fictional, with a real clinical presentation and up to six progressive clues, and you propose the diagnosis by searching for the code in ICD-10. Weighing the probability of a vaccine-preventable disease according to vaccination history, age and time of year is the kind of reasoning the clues train. Knowing how the ICD-10 code is built speeds up the search.
The limits on using the game are described on the NEXO economy page. If you research the teaching of clinical reasoning, the page for researchers explains how to get in touch. Professionals who write or review cases find information on the curator page, and those who produce health content can visit the creators page.
Frequently asked questions
What is the difference between efficacy and effectiveness?
Efficacy is the protection measured in a randomized trial, under controlled conditions. Effectiveness is the protection observed in routine use, estimated by observational studies (WHO, 2021).
If many cases occur in vaccinated people, did the vaccine fail?
It depends on coverage. With 9 in every 10 people vaccinated, half of the cases among the vaccinated still corresponds to an effectiveness near 89 in every 100, by the screening method (Orenstein, 1985).
What is the test-negative design?
A study in which everyone seen with a given condition is tested; the positives are cases and the negatives are controls. Effectiveness comes from comparing vaccination between the two groups (WHO, 2017).
Why do observational studies sometimes overstate protection?
Because of healthy vaccinee bias: those who get vaccinated tend to have a lower baseline risk. In older adults, the influenza vaccine appeared to reduce death even before the season (Lipsitch, 2016).
Does an efficacy of 95 in every 100 mean that 5 in every 100 vaccinated people get sick?
It means the vaccinated had about one twentieth of the risk of the placebo group. The fraction of vaccinated people who get sick depends on circulation and on follow-up time (Polack, 2020; Olliaro, 2021).
What is NNV?
It is the number of people who need to be vaccinated to prevent one case in the study period, the inverse of the absolute risk reduction (Olliaro, 2021).
Take-home messages
- Efficacy comes from the randomized trial; effectiveness, from routine use. Both are one minus the relative risk.
- Always state which effect the study estimates: direct, indirect or program.
- Healthy vaccinee bias can create protection where it is impossible; negative controls help detect it.
- The test-negative design reduces confounding by healthcare seeking, but it depends on assumptions and on strict criteria.
- With high coverage, many cases among the vaccinated are expected even with a very good vaccine.
- Relative reduction without baseline risk is half the information: ask for the absolute reduction and the NNV.
Play the case of the day on NEXO.
References
- World Health Organization. Evaluation of COVID-19 vaccine effectiveness: interim guidance, 17 March 2021. Geneva: WHO; 2021. WHO page.
- World Health Organization. Evaluation of influenza vaccine effectiveness: a guide to the design and interpretation of observational studies. Geneva: WHO; 2017. WHO page.
- World Health Organization. Guidelines on clinical evaluation of vaccines: regulatory expectations. WHO Technical Report Series 1004, Annex 9. Geneva: WHO; 2017. WHO page.
- Orenstein WA, Bernier RH, Dondero TJ, Hinman AR, et al. Field evaluation of vaccine efficacy. Bull World Health Organ. 1985;63(6):1055-1068. PMID 3879673. PMC2536484.
- Polack FP, Thomas SJ, Kitchin N, Absalon J, et al. Safety and Efficacy of the BNT162b2 mRNA Covid-19 Vaccine. N Engl J Med. 2020;383(27):2603-2615. PMID 33301246. DOI 10.1056/NEJMoa2034577.
- Dagan N, Barda N, Kepten E, Miron O, et al. BNT162b2 mRNA Covid-19 Vaccine in a Nationwide Mass Vaccination Setting. N Engl J Med. 2021;384(15):1412-1423. PMID 33626250. DOI 10.1056/NEJMoa2101765.
- Hernán MA, Robins JM. Using Big Data to Emulate a Target Trial When a Randomized Trial Is Not Available. Am J Epidemiol. 2016;183(8):758-764. PMID 26994063. DOI 10.1093/aje/kwv254.
- Lipsitch M, Jha A, Simonsen L. Observational studies and the difficult quest for causality: lessons from vaccine effectiveness and impact studies. Int J Epidemiol. 2016;45(6):2060-2074. PMID 27453361. DOI 10.1093/ije/dyw124.
- Sullivan SG, Tchetgen Tchetgen EJ, Cowling BJ. Theoretical Basis of the Test-Negative Study Design for Assessment of Influenza Vaccine Effectiveness. Am J Epidemiol. 2016;184(5):345-353. PMID 27587721. DOI 10.1093/aje/kww064.
- Lewnard JA, Tedijanto C, Cowling BJ, Lipsitch M. Measurement of Vaccine Direct Effects Under the Test-Negative Design. Am J Epidemiol. 2018;187(12):2686-2697. PMID 30099505. DOI 10.1093/aje/kwy163.
- Olliaro P, Torreele E, Vaillant M. COVID-19 vaccine efficacy and effectiveness – the elephant (not) in the room. Lancet Microbe. 2021;2(7):e279-e280. PMID 33899038. DOI 10.1016/S2666-5247(21)00069-0.