

Obstetrics and gynecologyGlobal healthCommunication and ethics
In a fictional case, a mobile team arrives in a populous neighborhood of a city with a high tuberculosis burden. In a single day, hundreds of adults undergo a digital chest radiograph, and there is a single radiologist for the entire region, who will only see the images weeks later. The team decides that software will give each image a score from 0 to 100, and anyone above a certain number will be referred for molecular sputum testing. The question that divides the team is simple to state and hard to answer: which number should be used?
Computer-aided detection, known by the acronym CAD, entered the World Health Organization (WHO) recommendation in 2021 as an alternative to the human reader in tuberculosis screening and triage. The WHO itself, however, insists that the cutoff must be calibrated for each context, because the same software, with the same threshold, behaves differently in different populations.
This text shows what the WHO recommended and with what strength, how studies measure the accuracy of these programs, what happens to false positives when the threshold is lowered, and which groups the software tends to get wrong most often.
Key points
Tuberculosis is the leading cause of death from a single infectious agent, and in 2024 it killed 1.23 million people, of whom 150 000 were living with HIV, according to the WHO fact sheet (WHO, 2026). In the same year, 10.7 million people fell ill: 5.8 million men, 3.7 million women and 1.2 million children.
The disease is concentrated where there are fewer resources. More than 80 percent of cases and deaths occur in low- and middle-income countries, and the South-East Asia, Western Pacific and African regions account for most of the burden (WHO, 2026). Travelers and professionals who care for people coming from these regions encounter the same diagnostic question in another setting.
The central problem is the gap between those who fall ill and those who are diagnosed. In the 2021 document, the WHO notes that, in 2019, about 2.9 million of the 10 million people with tuberculosis were not diagnosed or not reported (WHO, 2021). Some of these people have few or no symptoms, and only come to light when someone actively seeks them out.
The WHO separates two uses of radiography (WHO, 2021). In screening, radiography is offered to a population at risk, with or without symptoms, and tuberculosis prevalence usually stays below 5 percent (WHO, 2021). In triage, radiography is performed on people who have already sought care with symptoms, and prevalence is generally between 10 and 20 percent, according to the same document (WHO, 2021).
This difference in prevalence matters a great deal. As discussed in pretest probability, the same test, with the same sensitivity and specificity, produces very different proportions of false positives depending on whether the disease is rare or common in the population tested. Forgetting this is to fall into the error described in base rate in diagnosis.
In both uses, the X-ray confirms nothing. Anyone with an abnormal image goes on to a bacteriological test, such as the rapid molecular sputum test, and that test is what confirms the disease.
Module 2 of the WHO consolidated guidelines on tuberculosis, dedicated to screening, brought a new recommendation on automated reading (WHO, 2021). In free translation, the text says that, among individuals aged 15 or older in populations where tuberculosis screening is recommended, computer-assisted detection programs may be used instead of human readers to interpret digital chest radiographs in screening and triage for the disease. The guideline itself classifies the recommendation as conditional, with low certainty of evidence.
Both qualifiers matter. A conditional recommendation means that the group that drafted the guideline judged that the benefits probably outweigh the risks, but that the decision depends on context, resources and local values. Low certainty indicates that new studies may change the effect estimate.
The guideline development group reviewed three independent evaluations of three CE-marked products up to January 2020, and did the analysis without knowing which brands they were (WHO, 2021). The recommendation applies to digital radiographs in posteroanterior or anteroposterior incidence. Lateral and oblique views were excluded, and performance on digitized analog radiographs is unknown.
The document also sets the target. Accuracy was measured against bacteriologically confirmed tuberculosis, and the software does not detect lung diseases other than tuberculosis; there were no data on performance in differential diagnosis (WHO, 2021). This separates the topic from the incidental finding discussed in incidental pulmonary nodule and probability: there the image was taken for another reason and the reasoning starts from the probability of cancer; here the image is taken on purpose, at scale, to find a single disease.
Finally, the recommendation applies to products that are not shown to be inferior to those evaluated when tested in external validation. The WHO also cites the potential to widen access where radiologists are scarce, but makes feasibility conditional on equipment, internet connection and maintenance (WHO, 2021).
The group compared the software with human readers using the same bacteriological reference standard. To do this, it fixed the software threshold at the point where sensitivity reached about 90 percent and compared the resulting specificity with that of the readers (WHO, 2021). This number comes from the WHO target product profile, which asks for sensitivity above 0.90 and specificity above 0.70 for a triage test.
| Use | Reader | Sensitivity | Specificity |
|---|---|---|---|
| Target product profile | Goal | above 0.90 | above 0.70 |
| Screening | CAD software | 0.90 to 0.92 | 0.23 to 0.66 |
| Screening | Human reader | 0.82 to 0.93 | 0.14 to 0.63 |
| Triage | CAD software | 0.90 to 0.91 | 0.25 to 0.79 |
| Triage | Human reader | 0.89 to 0.96 | 0.36 to 0.63 |
Sources: WHO, 2021, Module 2, table 4 of the document; values expressed as proportions, ranges across studies, with no pooled estimate.
The table shows what the WHO called little difference between software and human reader. The specificity ranges are wide in both groups, and the document did not pool the estimates in a meta-analysis (WHO, 2021). The conclusion was similar accuracy, not superiority.
An earlier systematic review helps explain why the WHO was cautious (Harris et al., 2019). The authors gathered 53 studies, 40 development and 13 clinical evaluation. The median area under the curve was 0.88 in development studies and 0.75 in clinical ones, and specificity in clinical studies ranged from 0.23 to 0.69. The authors did not do a meta-analysis, because of heterogeneity and risk of bias.
The gap between the laboratory and the real world is common in AI tools. The same phenomenon appears in autonomous AI in diabetic retinopathy screening, where prospective validation was what gave credibility to clinical use. Readers who want a broader view of the topic can see the use of artificial intelligence in clinical reasoning.
Two independent evaluations put several programs in front of the same set of images. In a retrospective study with 1196 outpatients from Nepal and Cameroon, using the molecular test as reference, three programs had areas under the curve of 0.92 to 0.94 (Qin et al., 2019). The authors estimated that the software could reduce the molecular tests needed by 66 percent while keeping sensitivity at 95 percent or more (Qin et al., 2019).
In Vietnam, a library of 1032 radiographs was used to compare 12 programs with an expert reader and an intermediate reader (Codlin et al., 2021). Six programs performed on par with the expert. The authors point to the single-region origin, the retrospective design and a sample skewed toward people with suspected tuberculosis as limitations.
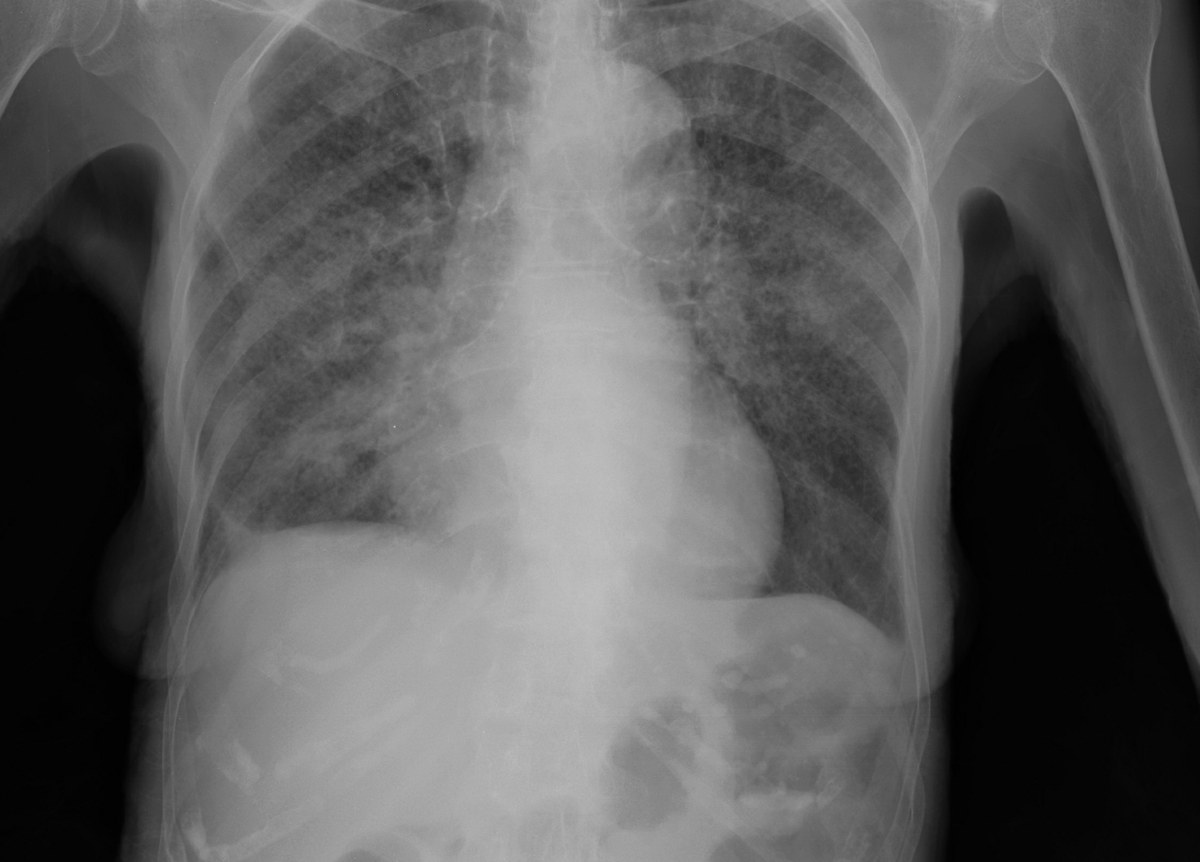
The software does not say "tuberculosis" or "normal". It returns a continuous score, and someone has to choose from what value the image will be treated as abnormal. A qualitative survey with users from nine high-burden countries sums up the dilemma: raising the threshold makes the software more specific and less sensitive, lowering the threshold does the opposite, and no threshold is at the same time perfectly sensitive and perfectly specific (Creswell et al., 2023). The best point is the one that balances accuracy with the volume of confirmatory tests the service can absorb.
The work by Vanobberghen and colleagues is described by the authors as a secondary analysis of the 2019 Lesotho national tuberculosis prevalence survey (Vanobberghen et al., 2024). A total of 17 070 people aged 15 or older took part. Because only those with symptoms or an abnormal radiograph underwent the bacteriological test, only 5214 participants had their tuberculosis status determined, and 142 had the disease.
To deal with those who were not tested, the authors compared six methods. With multiple imputation, threshold 13 gave sensitivity of 89.7 percent, with a 95 percent confidence interval of 84.6 to 94.8, and specificity of 74.2 percent, with an interval of 73.6 to 74.9 (Vanobberghen et al., 2024). Assuming that all untested people were negative led to similar results.
| Software threshold | Sensitivity (percent) | Specificity (percent) |
|---|---|---|
| 3 | 96.5 | 38.1 |
| 5 | 93.7 | 54.2 |
| 8 | 91.5 | 65.5 |
| 10 | 90.1 | 69.7 |
| 13 | 90.1 | 74.2 |
Sources: Vanobberghen et al., 2024, table 3, approach that treats untested people as negative; score from 0 to 100 of a specific version of the software.
Between thresholds 13 and 10, sensitivity stayed the same and specificity fell. From threshold 13 to threshold 3, sensitivity gained 6.4 percentage points, while specificity lost 36.1 points. The authors describe the drops in specificity at the lower thresholds as substantial.
An illustrative calculation, made by us from table 3 of Vanobberghen and colleagues, and not by the authors, helps to show the effect. In 1000 people without tuberculosis, a specificity of 74.2 percent leaves about 258 images falsely abnormal, while a specificity of 38.1 percent leaves about 619, according to the study values (Vanobberghen et al., 2024). Each of these people needs sputum collection, a molecular test and an answer, and some may end up treated without confirmation, the kind of excess discussed in overdiagnosis.
The same study offers a contrast with human reading in the field. Human reading of the radiographs in the survey, incorporating central reading when available, had sensitivity of 47.2 percent and specificity of 96.5 percent (Vanobberghen et al., 2024). Human reading was far more specific and far less sensitive than the software at the chosen threshold.
The authors list important problems. Many radiographs were missing, more so in urban areas, which may compromise representativeness; about 19 percent of the people invited refused the survey, in a higher proportion young men from urban areas (Vanobberghen et al., 2024). Multiple imputation depends on the assumption that data are missing at random. In addition, the prevalence estimate ranged from 0.83 to 2.72 percent depending on the method, which shows how much the result depends on how the untested are handled (Vanobberghen et al., 2024). One of the authors is from the WHO.
Lesotho's optimal threshold does not work for other places. The authors themselves cite thresholds of 50 in Bangladesh and 20 in South Africa for the same type of program and conclude that the threshold depends on context (Vanobberghen et al., 2024). In the study of Nepal and Cameroon, the cutoff of one same program that guaranteed the desired sensitivity was 63 in one country and 48 in the other, and a universal threshold performed differently in each location (Qin et al., 2019).
The users heard by Creswell and colleagues report that the choice of threshold still generates controversy among policymakers and that the strategies used were diverse and poorly structured, and they consider calibration studies difficult to do and necessary to repeat (Creswell et al., 2023). The WHO special program for research in tropical diseases published a process to guide this choice.
The average specificity hides groups in which the software fails more. The individual data meta-analysis by Tavaziva and colleagues gathered 3727 participants from four studies, with about 17 percent of people with HIV and 17 percent with confirmed tuberculosis (Tavaziva et al., 2022). With pooled sensitivity fixed at 90 percent, the specificities of three programs were between 54.1 and 60.5 percent (Tavaziva et al., 2022).
The biggest drop appeared in those who had already had tuberculosis. In the same meta-analysis, specificity was 26.6 to 33.7 percent in people with prior treatment and 58.0 to 69.3 percent in the others (Tavaziva et al., 2022). Sensitivity was also lower in smear-negative tuberculosis and, for two of the products, in people with HIV. The authors conclude that thresholds should be defined based on each user's populations, and acknowledge that data from three of the seven eligible studies were not available and that CD4 data were missing.
A study in Lusaka, Zambia, looked at this group closely. The authors describe a retrospective analysis of a prospective cross-sectional case-finding study, with 1884 symptomatic people aged 15 or older, of whom 452, or 24.0 percent, had previous tuberculosis (Kagujje et al., 2023). With thresholds set for 90 percent sensitivity, the specificity of one program was 24.0 percent in those with previous tuberculosis and 60.3 percent in those without; that of another was 22.2 versus 61.8 percent (Kagujje et al., 2023). The study had no comparison with a human reader, the tuberculosis history was self-reported and the reference standard was the molecular test.
The scars of treated tuberculosis remain visible on the radiograph, and the software tends to read these sequelae as active disease. In the Vietnamese evaluation, most programs performed significantly worse in people with previous tuberculosis (Codlin et al., 2021).
In South Africa, an external validation used a case-control sample of 774 people aged 15 or older, 258 of them with tuberculosis, taken from the national prevalence survey of 2017 to 2019, to test 12 programs (Qin et al., 2024). The areas under the curve were about 0.9 in the best to less than 0.8 in the worst, and all products performed worse in older people, in those with previous tuberculosis and in those with HIV. The authors acknowledge that the study was underpowered, with 258 people with tuberculosis against 291 needed, that part of the data was self-reported and that asymptomatic people with a normal radiograph were excluded.
In Lesotho, sensitivity varied greatly with HIV status, depending on the score, but specificity barely changed (Vanobberghen et al., 2024), which shows how these findings vary between populations. In the Vietnam evaluation, the type of radiography equipment also affected the performance of some programs (Codlin et al., 2021).
The practical lesson is that the operator needs to know who is in front of the device. A queue with many older adults and many people already treated will produce more false positives than a queue of young people with no history of tuberculosis, even with the same threshold.
Software changes over time. In a case-control set of 12 890 radiographs from Bangladesh, the area under the curve of one program rose from 0.823 in one version to 0.903 in the next, and that of another went from 0.872 to 0.906 (Qin et al., 2022). The newer versions met the WHO target product profile, but the update changed the thresholds that gave the same sensitivity, and the authors recommend reassessing with local data. The study did not use culture, did not use the most sensitive version of the molecular test and excluded those under 15 years of age.
The WHO guideline covers implementation in section 4.4 (WHO, 2021). The document describes substantial variation between sites even with the same software and the same threshold, and therefore calls for local calibration of the score according to the program's objectives, followed by continuous monitoring. This monitoring compares the software's readings with those of human readers, with bacteriological results and with the proportion of images classified as abnormal. An operational manual, a calibration protocol and an online tool accompany the guideline.
When the machine decides who goes on to testing, the team tends to stop looking at the images it called normal. This risk is the subject of automation bias. The proportion of abnormal images is a good alarm: if it rises or falls without a change in the population, something has changed in the device, the software or the workflow.
The software also changes who does what. In many places, the person who operates the device and refers the patient is a technician or community health worker, not a physician, an arrangement discussed in task shifting. In low-resource settings, radiography read by software coexists with other simple tests, such as those described in low-resource diagnosis.
A recent study suggests that the score may carry information beyond the time of the examination. In a prospective cohort of 483 household contacts of people with rifampicin-resistant tuberculosis in South Africa, followed for a median of 4.6 years, there were 23 people with prevalent tuberculosis and 38 with incident tuberculosis (Macpherson et al., 2025). The area under the curve was 0.87 to 0.91 for prevalent disease and 0.60 to 0.65 for incident disease. More than 30 percent of the people above the threshold, with routine sputum negative, were diagnosed later, through expanded sputum investigation or during follow-up (Macpherson et al., 2025). The authors warn that the lower thresholds tested had no external validation and that the study was conducted in a high-burden setting.
The WHO recommendation applies to people aged 15 or older, and the guideline lists software for children as an urgent research gap (WHO, 2021). Pediatric radiography is different: hilar and mediastinal lymph nodes dominate the picture, and the image changes with age.
The study by Palmer and colleagues used radiographs from 620 children under 13 years of age enrolled in a prospective observational diagnostic study in Cape Town between 2012 and 2017 (Palmer et al., 2023). A total of 525 images were analyzed, with a test set of 80, half with tuberculosis and half without. The reference standard was the radiological reading of a panel of experts, not bacteriological confirmation.
The adult version of the software had an area under the curve of 0.58 in this dataset. After fine-tuning with pediatric images, the area rose to 0.72, a statistically significant difference with p of 0.0016 (Palmer et al., 2023). Even improved, performance remained far from what was seen in adults.
The authors acknowledge that the dataset was small for deep learning, that the reference standard depended on human reading, and that the specialists disagreed among themselves on 25 of the 80 test images (Palmer et al., 2023). The population was children under diagnostic investigation, not screening. One of the coauthors belongs to the company that develops the software. The study is a proof of concept, and it does not support the use of the software in children.
The team in our fictional case now has more useful questions than "which number to use". How many molecular tests per day can the laboratory handle? What is the expected prevalence in this queue? How many people have already had tuberculosis? Is the software version the same as in the calibration studies?
With these answers, the team can choose an initial threshold, record the proportion of abnormal images and compare a sample of readings with the radiologist and with the sputum results. If the queue has many adults treated in the past, it should expect more false positives and adjust the flow. And it should remember that young children who pass through the unit fall outside the recommendation and need clinical assessment.
In NEXO, the case of the day is fictional, with a real clinical presentation and up to six progressive clues, and you propose the diagnosis by searching for the code in ICD-10. Choosing a threshold requires the same exercise: weighing the probability before the exam, asking who is being tested and deciding what to do with a result that does not fit, as in training differential diagnosis with clues.
The limits of use of the game are described on the NEXO economy page. If you research the teaching of clinical reasoning, the page for researchers explains how to get in touch. Professionals who write or review cases find information on curation and on creators, and institutions can learn about the proposal on the partnerships page. Searching for the right ICD-10 code completes this training.
It indicates who should go on to a confirmatory test. WHO evaluated the software against bacteriologically confirmed tuberculosis, and confirmation still depends on the sputum test (WHO, 2021).
WHO classifies it as conditional, with low certainty of evidence, and restricted to people aged 15 or older and to digital frontal radiographs (WHO, 2021).
Studies show optimal thresholds that differ greatly between countries and between versions of the same program, and WHO calls for local calibration (Vanobberghen et al., 2024; Qin et al., 2022).
Because, near the point where sensitivity is already high, each small gain in sensitivity causes a large loss of specificity. In Lesotho, going from threshold 13 to 3 gained 6.4 points of sensitivity and lost 36.1 of specificity (Vanobberghen et al., 2024).
They can, but specificity falls sharply in this group, and the service should expect many referrals without active disease (Tavaziva et al., 2022; Kagujje et al., 2023).
The WHO recommendation excludes those under 15, and the best pediatric study available is a proof of concept with a small sample (Palmer et al., 2023).