Carbon footprint of care: what clinicians control
Table of contents
- How much health care emits
- Tests: the carbon of the unnecessary order
- Inhalers: choosing the device
- Anesthetic gases and the operating room
- Travel, telemedicine and prescribing
- What the clinician controls in practice
- How NEXO helps train this reasoning
- Frequently asked questions
- Take-home messages
- References
A family physician finishes the morning consultations and reviews what she ordered. A complete blood count, kidney function and electrolytes for a stable patient who had the same tests two months ago. A vitamin D level for a young woman with no risk factor. A CT scan for low back pain with no red flag, which the patient requested. A rescue aerosol inhaler, without asking whether the person would adapt well to a dry powder device. None of this is a serious error. But each of these choices has an impact that rarely enters the conversation: greenhouse gas emissions.
The health sector is a major emitter, and much of the emissions depends on everyday clinical decisions. The good news is that many of the lower-impact choices coincide with better-quality care: fewer unnecessary tests, devices suited to the patient, rational use of imaging, remote consultations when they make sense.
This text organizes what is known about the carbon footprint of care, where the main emission points are and what the clinician can control without giving up patient safety.
Key points
- Health systems emit a relevant share of a country's greenhouse gases.
- Most of it comes from the supply chain: medicines, equipment and consumables.
- Unnecessary tests add emissions without bringing any benefit to the patient.
- MRI and CT emit far more per exam than radiography and ultrasound.
- Aerosol inhalers have a much larger footprint than dry powder ones.
- Anesthetic gases, travel and waste are other points where the clinical choice matters.
How much health care emits
The most used measure to compare emissions is carbon dioxide equivalent (CO2e), which converts different greenhouse gases into a common unit. With it, it is possible to estimate the impact of an entire health system, of a hospital or of a single procedure.
England's national health service has done this accounting since 2008. In 2019, its emissions totaled 25 megatonnes of CO2e (Tennison and colleagues, 2021). That represented a drop of 26 in every 100 compared with 1990 and of 64 in every 100 in emissions per completed hospital admission. The distribution shows where the problem lies: 62 in every 100 came from the supply chain, 24 from direct delivery of care, 10 from travel by staff, patients and visitors and 4 from private services contracted by the system.
In Canada, a study estimated that the health system accounted for 33 million tonnes of CO2e, or 4.6 in every 100 of the national total (Eckelman and colleagues, 2018). The authors went beyond climate and calculated the harm to health caused by pollution associated with the sector: a median of 23,000 disability-adjusted life years (DALYs) lost per year, with an uncertainty range of 4,500 to 610,000. Hospitals and medicines were the spending categories with the greatest weight. Most of the harm to health came from pollutants that are not greenhouse gases, especially particulate matter.
Besides greenhouse gases, the Canadian sector emitted more than 200,000 tonnes of other pollutants (Eckelman and colleagues, 2018). It was the sum of these pollutants, and not only of the greenhouse gases, that produced the estimate of life years lost, which shows that the sector's footprint has direct effects on the population's health.
These numbers carry an obvious irony. The sector that exists to care for health contributes to problems that harm it. This is not a reason for individual guilt, but it is a strong argument for looking carefully at the choices that depend on whoever provides the care.
Where the hot spots are
A review of 76 studies analyzed the carbon footprint of 151 hospital services and care pathways across several specialties (Kouwenberg and colleagues, 2024). The values varied enormously: from 0.01 kg of CO2e per hour of intravenous anesthesia to 10,200 kg of CO2e for a year of hemodialysis.
Travel, facilities and consumables were the main sources of emissions, while waste disposal had a smaller contribution (Kouwenberg et al., 2024). In the studies that included medicines, their contribution was relatively large, especially that of anesthetic gases. The relative importance of each source changed with the service, the specialty and the location, and the footprint of similar services varied considerably between institutions.
The review also pointed out limits. The studies used different methods, with varied units and boundaries of analysis, and a quarter of them were not of sufficient quality (Kouwenberg et al., 2024). The numbers serve to identify where to act, but they should be read as estimates, not as exact values.
Tests: the carbon of the unnecessary order
Laboratory tests seem small from an environmental point of view, and each one indeed is. The problem is the volume and the fact that a considerable share does not change management.
A study at a Canadian tertiary hospital assessed inpatients with acute uncomplicated surgical conditions, such as appendicitis, cholecystitis and bowel obstruction from adhesions (Spoyalo et al., 2023). Of the 83 patients reviewed in detail, 63 underwent blood tests that were unnecessary according to consensus recommendations. On average, each had 1.84 venipunctures, 4.4 blood tubes, 16.5 tests and 18 mL of blood drawn without need. The emissions from these tests totaled 61 kg of CO2e. A common panel, with complete blood count, differential, creatinine, urea, sodium and potassium, had a footprint of 332 g of CO2e. Adding a liver panel added another 462 g.
The burden on the patient comes with it. Repeated punctures cause pain, and blood loss from collection contributes to anemia in long hospital stays. The study was designed precisely to show that the same excess weighs at the same time on the patient, on the hospital budget and on the environment.
In Australia, a study analyzed a classic example of low-value care: vitamin D testing (Breth-Petersen et al., 2022). In 2020, 4,457,657 tests funded by the public system were performed, on average one for every six Australians. Based on the literature, the authors estimated that 76.5 out of every 100 of these tests bring no net benefit, which is equivalent to 3,410,108 unnecessary tests. The footprint of these tests was 28,576 kg of CO2e in the main scenario, the equivalent of driving 160,000 to 230,000 km in a passenger car. The authors acknowledge that this isolated example has a small footprint, but they highlight the potential to reduce low-value care more broadly.

Imaging: the difference between methods
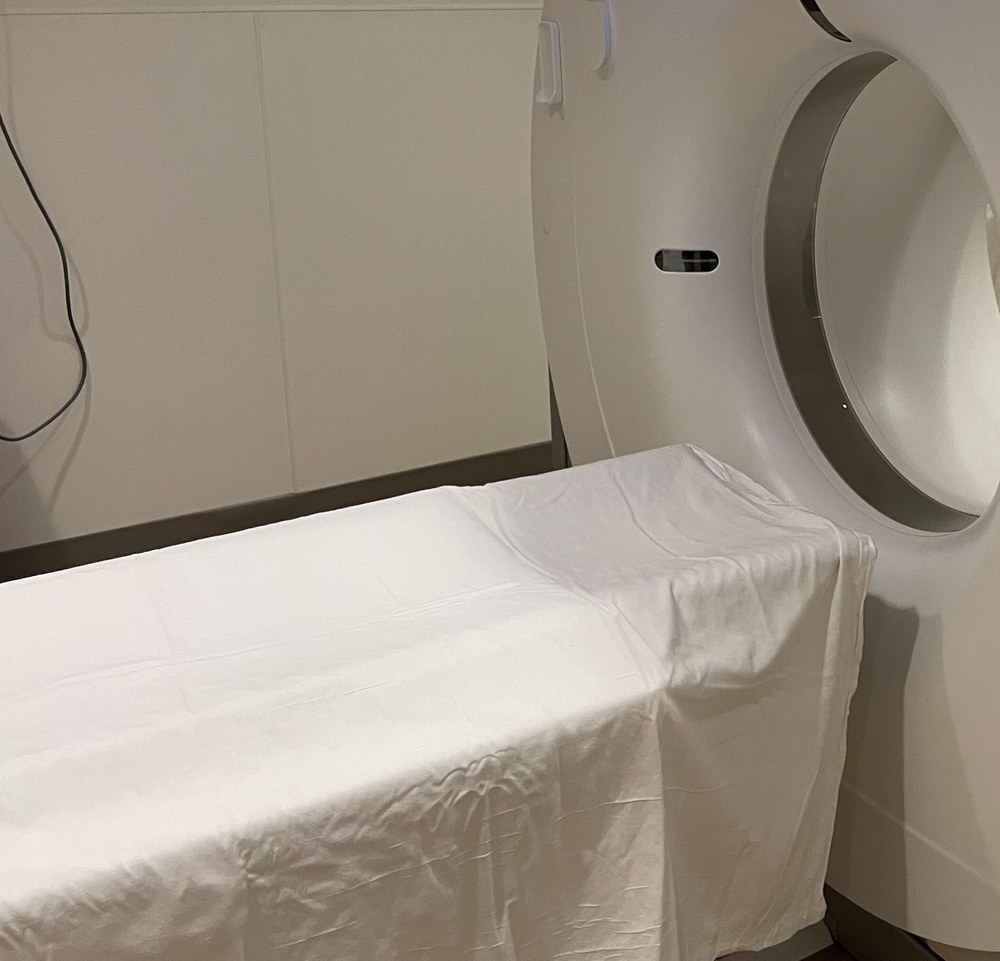
A study at two Australian university services measured the footprint of five imaging methods, including the energy of the machines and all consumables, such as bed linen, contrast and gloves (McAlister et al., 2022). The average emissions per exam were:
- magnetic resonance imaging, 17.5 kg of CO2e;
- computed tomography, 9.2 kg;
- chest radiography, 0.8 kg;
- portable chest radiography, 0.5 kg;
- ultrasound, 0.5 kg.
An important part of the emissions came from the energy consumed by the machines in standby mode (McAlister et al., 2022). When the authors calculated only the impact of one more exam, without the standby energy, the values fell to 1.1 kg for magnetic resonance and computed tomography, 0.6 kg for chest radiography and 0.1 kg for portable radiography and ultrasound.
The topic is not marginal. The authors recall that, in the health system of the Australian state of New South Wales, laboratory and imaging tests together accounted for about 9 out of every 100 of the sector's carbon footprint (McAlister et al., 2022). Every order avoided counts, and the choice of method counts even more.
The authors propose three fronts (McAlister et al., 2022). The first is clinical: reduce unnecessary orders and prefer radiography and ultrasound instead of magnetic resonance and computed tomography when this is clinically appropriate. The second and third are managerial: switch off the machines whenever possible and keep usage rates high, to spread standby consumption over more exams.

Inhalers: choosing the device
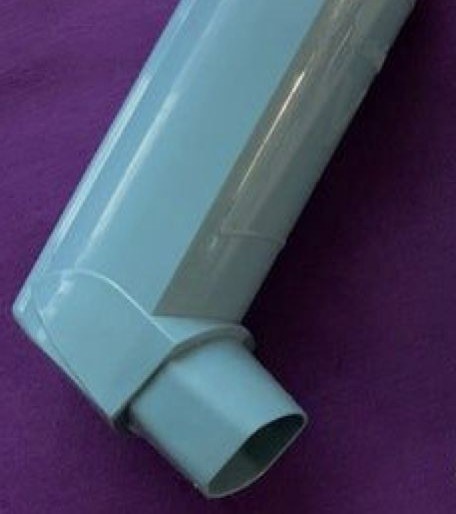
Inhalers are one of the clearest examples of how a prescribing choice changes the carbon footprint. Until the 1990s, metered-dose aerosols used chlorofluorocarbons as propellants. They were replaced by dry powder inhalers and by aerosols with hydrofluorocarbons, which do not destroy the ozone layer but are potent greenhouse gases (Janson et al., 2020).
One study compared the annual per-patient footprint of two equivalent maintenance and rescue regimens (Janson et al., 2020). With dry powder devices, the footprint was 17 kg of CO2e per year. With metered-dose aerosols, it was 439 kg. The difference also appears between countries: in 2017, 70 out of every 100 inhalers sold in England were aerosols, against 13 out of every 100 in Sweden. If England had the Swedish distribution, the reduction would be 550 kilotonnes of CO2e per year. The authors stress that the lower footprint of dry powder should be weighed together with other factors when choosing the device.
Another study with prescribing data from England calculated that, for every 10 out of every 100 aerosols switched to dry powder inhalers, 58 kilotonnes of CO2e per year would be saved (Wilkinson et al., 2019). The study also showed large differences within the same category. Some rescue aerosols exceed 25 kg of CO2e per inhaler, while others, with a smaller volume of the same propellant, have a much smaller footprint. The authors conclude that small-volume aerosols are preferable to large-volume ones or to those that use the propellant with the highest global warming potential.

In the English public system survey, inhaler propellants appear alongside anesthetic gases among the direct emissions of care, because they are released into the atmosphere unchanged (Tennison et al., 2021). It is one of the few emission sources where the decision is entirely in the hands of the prescriber.
The decision, however, is clinical before it is environmental. Small children, older adults with little inspiratory strength and patients in crisis may not be able to use a dry powder device well. The switch only makes sense when the patient uses the new device with proper technique and keeps the disease under control. In practice, the periodic review of inhalation technique is an opportunity to discuss both things.
Anesthetic gases and the operating room
The operating room concentrates several emission sources. Volatile anesthetics and nitrous oxide are potent greenhouse gases, released into the atmosphere without being metabolized (Tennison et al., 2021). Among them, desflurane accounts for an important part of the operating room footprint (Caycedo-Marulanda and Mathur, 2022).
A tertiary hospital in Ontario, Canada, decided to phase out desflurane (Caycedo-Marulanda and Mathur, 2022). First came classes and discussions with the team, then stickers on the vaporizers warning about the climate impact, then removal of the vaporizer from the rooms and finally exclusion of desflurane from the hospital's medication list. Desflurane emissions fell from 744 tonnes of CO2e in 2016 to 140 in 2019 and zero in 2020. Sevoflurane emissions rose from 31 tonnes in 2016 to 66 in 2019 and 52 in 2020.
The authors noted that desflurane users migrated to sevoflurane, and not to other strategies such as total intravenous anesthesia or regional anesthesia, which could have reduced the footprint even further (Caycedo-Marulanda and Mathur, 2022). They cite their own study in which avoiding desflurane changed neither morbidity nor mortality in one type of surgery, but they stress that the topic needs more investigation. The review of 76 studies points in the same direction: one hour of intravenous anesthesia had one of the smallest footprints among the services analyzed (Kouwenberg et al., 2024).
Waste is another front. Hospitals in Europe produce about 6 million tons of waste per year, and about one third comes from the operating room (Leone et al., 2024). Only 2 to 3 out of every 100 hospital waste items need to be discarded as infectious, but 50 to 70 out of every 100 end up in the biological risk stream. A waste separation program in an operating room in Turin reduced the number of boxes and the weight of biological risk waste over 18 months. One of the barriers to recycling, according to the authors, is not separating infectious waste from clean waste.
Travel, telemedicine and prescribing
Patient and staff travel appears among the main sources of emissions in several studies (Kouwenberg et al., 2024; Tennison et al., 2021). Telemedicine emerges as an alternative in selected situations.
A study in two rehabilitation units of a Swedish university hospital compared video conference consultations with in-person consultations (Holmner et al., 2014). The substitution reduced emissions 40 to 70 times. In the most conservative scenario, telemedicine was already the greener option from just a few kilometers away, when the alternative was going by car.
A systematic review of 33 articles found a median of 131 km round trip per patient, or 25.6 kg of CO2 per in-person consultation avoided (van der Zee et al., 2024). Distance traveled was the factor that weighed most. The authors observed that studies vary widely in the variables included and that avoided emissions tend to be underestimated when life cycle analysis is not considered.
Telemedicine does not replace the physical examination when it is needed, and the choice must start from the clinical question. But for routine follow-ups, review of test results and monitoring of stable chronic diseases, especially in patients who live far away, it combines convenience and lower impact.
Prescribing also leaves a trace. In the United States, 236,100,000 antibiotic prescriptions were written in 2022, and 66,108,000 of them were probably unnecessary (Spivak et al., 2024). Each prescription generated 32 g of paper waste and 15 g of plastic. The authors acknowledge that the analysis underestimates emissions, because it considered only solid waste, without including the production and transport of the medications. The main argument for rational antibiotic use remains bacterial resistance, but the environmental gain comes along with it.
What the clinician controls in practice
Much of the sector's emissions are beyond the reach of those who provide care: building energy, supply chain, transport of goods. But several decisions that weigh on the footprint are made in the office, on the ward and in the operating room.
| Clinical choice | What the studies show | How to apply without harm to the patient |
|---|---|---|
| Routine laboratory tests | Unnecessary orders add up punctures, tubes and emissions | Order when the result can change management |
| Imaging method | MRI and CT emit far more than radiography and ultrasound | Prefer the lower-impact method when it is clinically appropriate |
| Inhalers | Dry powder has a much smaller annual footprint than aerosol | Consider dry powder when the patient uses the device well |
| Anesthesia | Desflurane carries great weight; intravenous anesthesia has a low footprint | Review the choice of agent with the anesthesia team |
| Waste in the operating room | Much clean waste goes into the infectious stream | Separate what has not touched body fluids |
| Follow-up consultations | Travel is a relevant source of emissions | Use telemedicine when in-person examination is not needed |
| Antibiotics | Unnecessary prescriptions generate waste with no benefit | Prescribe only with a clear indication |
The common logic is simple: lower-impact care is, most of the time, care that avoids waste. The test order that does not change management, the CT that could be an ultrasound and the antibiotic without an indication were already quality problems before they were environmental problems. Well-made clinical decision-making solves both at the same time.
Thinking about the pretest probability before ordering a test is, in this sense, also an environmental choice. When the chance that the result will change management is very low, the test adds cost, discomfort and emissions with no benefit. Recording in the medical record why a test was or was not ordered helps the team keep this consistency.
Mistakes that repeat
The first mistake is thinking the environmental impact is only a management matter. The choice of tests, devices and anesthetics is clinical, and the review of 76 studies shows that medications and consumables weigh heavily (Kouwenberg et al., 2024).
The second mistake is switching the inhaler device without assessing the patient. The smaller footprint of dry powder only counts if the patient uses the new device well and keeps the disease under control (Janson et al., 2020).
The third mistake is repeating tests out of habit. Data from surgical patients and from vitamin D show that excess is common and adds emissions without bringing benefit (Spoyalo et al., 2023; Breth-Petersen et al., 2022).
The fourth mistake is treating numbers from different studies as comparable. Methods vary widely, and the footprint of the same service changes between institutions (Kouwenberg et al., 2024). The values serve to guide priorities, not for exact comparisons.
The fifth mistake is turning the topic into individual guilt. Diagnostic uncertainty sometimes justifies extra tests, and patient safety always comes first. The goal is to reduce waste, not necessary care.
How NEXO helps train this reasoning
In NEXO, the case of the day is fictional, with a real clinical presentation and up to six progressive clues, and you propose the diagnosis by looking for the code in ICD-10.
The limits of using the game are described on the NEXO Economy page. If you research the teaching of clinical reasoning, the page for Researchers explains how to get in touch. Professionals who write or review cases find information under Curator and Creators, and institutions can learn about the proposal on the partnerships page. Training differential diagnosis with clues and looking for the right ICD-10 code complete this practice.
Frequently asked questions
How much does the health sector contribute to emissions?
It depends on the country. In Canada, the health system accounted for 4.6 out of every 100 national emissions. In England, the public service emitted 25 megatonnes of CO2e in 2019, most of it through the supply chain.
Do laboratory tests really make a difference?
Each test has a small footprint, but the volume is enormous. In Australia, unnecessary vitamin D tests in one year emitted the equivalent of driving 160,000 to 230,000 km by car. The greatest benefit of avoiding excess is for the patient.
Should I switch all aerosol inhalers to dry powder?
Not automatically. Dry powder has a much smaller footprint, but it requires adequate technique and inspiratory flow. Switching makes sense when the patient uses the new device well and keeps the disease under control.
Which imaging test has the lowest impact?
Per test, radiography and ultrasound emit far less than CT and MRI. When they are clinically appropriate, they are the lower-impact option.
Does telemedicine always reduce emissions?
In most studies, yes, especially when it replaces car trips. But it should only be used when an in-person examination is not needed for the clinical decision.
Take-home messages
- The health sector is a relevant emitter, and the supply chain is the largest source.
- Tests without an indication add punctures, costs and emissions with no benefit.
- MRI and CT emit far more than radiography and ultrasound.
- Dry powder inhalers have a much smaller footprint, when the patient uses them well.
- Desflurane weighs heavily; intravenous anesthesia has a low footprint.
- Lower-impact care is usually the care that avoids waste.
References
- Breth-Petersen M, Bell K, Pickles K, et al. Health, financial and environmental impacts of unnecessary vitamin D testing: a triple bottom line assessment adapted for healthcare. BMJ Open. 2022. PMID 35998953.
- Caycedo-Marulanda A, Mathur S. Suggested strategies to reduce the carbon footprint of anesthetic gases in the operating room. Can J Anaesth. 2022. PMID 34664201.
- Eckelman MJ, Sherman JD, MacNeill AJ. Life cycle environmental emissions and health damages from the Canadian healthcare system: An economic-environmental-epidemiological analysis. PLoS Med. 2018. PMID 30063712.
- Holmner A, Ebi KL, Lazuardi L, et al. Carbon footprint of telemedicine solutions--unexplored opportunity for reducing carbon emissions in the health sector. PLoS One. 2014. PMID 25188322.
- Janson C, Henderson R, Löfdahl M, et al. Carbon footprint impact of the choice of inhalers for asthma and COPD. Thorax. 2020. PMID 31699805.
- Kouwenberg LHJA, Cohen ES, Hehenkamp WJK, et al. The Carbon Footprint of Hospital Services and Care Pathways: A State-of-the-Science Review. Environ Health Perspect. 2024. PMID 39729358.
- Leone N, Scozzari G, Olandese F, et al. "O.R. GOES GREEN": a first step toward reducing our carbon footprint in the operating room and hospital. Updates Surg. 2024. PMID 38526697.
- McAlister S, McGain F, Petersen M, et al. The carbon footprint of hospital diagnostic imaging in Australia. Lancet Reg Health West Pac. 2022. PMID 35538935.
- Spivak ES, Tobin J, Hersh AL, et al. Greenhouse gas emissions due to unnecessary antibiotic prescriptions. Antimicrob Steward Healthc Epidemiol. 2024. PMID 39257428.
- Spoyalo K, Lalande A, Rizan C, et al. Patient, hospital and environmental costs of unnecessary bloodwork: capturing the triple bottom line of inappropriate care in general surgery patients. BMJ Open Qual. 2023. PMID 37402596.
- Tennison I, Roschnik S, Ashby B, et al. Health care's response to climate change: a carbon footprint assessment of the NHS in England. Lancet Planet Health. 2021. PMID 33581070.
- van der Zee C, Chang-Wolf J, Koopmanschap MA, et al. Assessing the Carbon Footprint of Telemedicine: A Systematic Review. Health Serv Insights. 2024. PMID 39139395.
- Wilkinson AJK, Braggins R, Steinbach I, et al. Costs of switching to low global warming potential inhalers. An economic and carbon footprint analysis of NHS prescription data in England. BMJ Open. 2019. PMID 31662306.