Incidental pulmonary nodule: Fleischner and probability
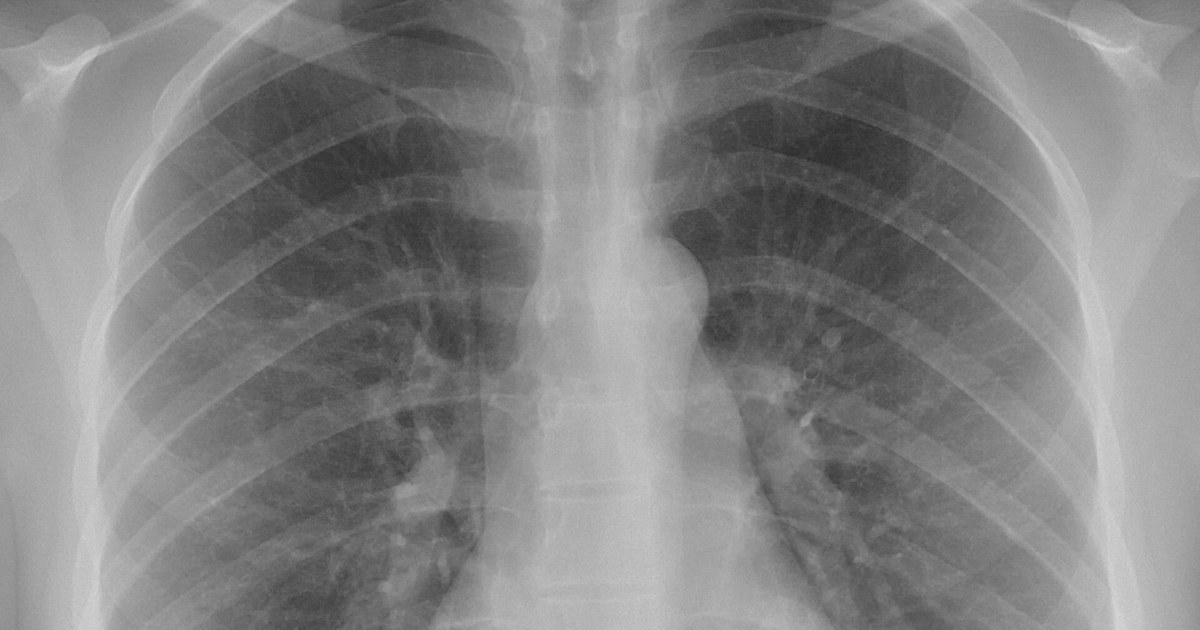
Table of contents
- Incidental nodule: from finding to clinical problem
- Probability before the rule
- Fleischner: who it applies to and what it recommends
- Measuring and tracking growth
- Risk models: help, not an oracle
- From recommendation to practice
- How NEXO helps train this reasoning
- Frequently asked questions
- Take-home messages
- References
The CT scan was ordered to investigate abdominal pain, but the report ends with a line that changes the day: a solid nodule in the right upper lobe, clinical correlation is suggested. The patient asks whether it is cancer. The attending physician does not know whether to order another CT scan, refer to a pulmonologist or simply reassure. He opens the guideline on his phone and finds a table full of millimeters, but the table requires a piece of information that is not in the report: the patient's risk.
This scene sums up the problem of the incidental pulmonary nodule. The follow-up rule exists and is well known, but it only works when the physician combines size, appearance and pretest probability. Without that calculation, the same nodule can lead to an unnecessary biopsy in one person and a missed cancer in another.
This text reviews how to estimate the probability of cancer in a nodule found by chance, what the Fleischner Society recommendations say for each size and type, how to measure growth and where real-world practice often fails.
Key points
- Most incidental nodules are benign, but the probability varies widely with the person's profile and the nodule's profile.
- Fleischner applies to adults with no known cancer and no immunosuppression, and its table depends on separating low and high risk.
- Size, type (solid, ground-glass or part-solid) and morphology change management.
- Models such as Brock (PanCan) help estimate risk, but they perform worse in high-prevalence populations.
- Small measurement differences can mimic growth; volume and doubling time help with interpretation.
- Many nodules do not receive the recommended follow-up, and others receive too many tests.
Incidental nodule: from finding to clinical problem
According to the Fleischner Society glossary, a pulmonary nodule is an opacity of more than 3 mm and up to 3 cm in diameter, with no prior determination of benignity or malignancy (Schmid-Bindert et al., 2022). By appearance on CT, nodules are solid or subsolid, and subsolid nodules are divided into pure ground-glass and part-solid (Larici et al., 2017). This simple classification already defines much of the management, because each type has a different behavior and risk.
The finding has become more frequent with the growing use of CT. A review on the management of incidental nodules describes an increase in detection from 24 to 31 per 100 chest examinations, with incidence rising from 3.9 to 6.6 per 1000 person-years (Schmid-Bindert et al., 2022). In other words, every clinician, in any specialty, will receive reports with nodules.
Most of these nodules are benign. In two large Canadian studies used to build the Brock model, cancer appeared in 5.5 per 100 people with nodules in the PanCan cohort and in 3.7 per 100 in the BCCA cohort (McWilliams et al., 2013). The PanCan cohort included 1871 people and 7008 nodules, of which 102 were malignant; the BCCA included 1090 people and 5021 nodules, with 42 malignant (McWilliams et al., 2013).
These numbers remind us that, in the screening population, each individual nodule has a low probability of being cancer. But the probability changes substantially depending on the person and the nodule, and that is where clinical reasoning comes in. The text on pretest probability explores this logic for other tests.
Probability before the rule
The Fleischner table asks the physician to classify the patient as low or high risk before choosing the follow-up interval (Kapoor et al., 2020). The most recent revision of the guideline lists as clinical factors of malignancy older age, current or past heavy smoking, exposure to other inhaled carcinogens such as asbestos, radon or uranium, emphysema or fibrosis, and family history of lung cancer (Larici et al., 2017). Other guidelines use models: the American College of Chest Physicians suggests the Mayo Clinic model, with intermediate risk between 5 and 65 per 100 and high risk above 65 per 100, and the British one suggests the Brock and Herder models (Larici et al., 2017).
What raises the probability
In the study that gave rise to the Brock model, the factors associated with cancer were older age, female sex, family history of lung cancer, emphysema, larger nodule, location in the upper lobe, partially solid nodule, fewer nodules and spiculation (McWilliams et al., 2013). Some of these factors go against intuition. Having many nodules, for example, reduced the probability that each one of them was cancer (McWilliams et al., 2013).
Size is the best-known factor. In the early screening studies, solid nodules under 5 mm had a cancer risk of 1 per 100 or less, and in the Mayo Clinic screening study most cancers, 80 per 100, measured more than 8 mm (Larici et al., 2017). In the NELSON study, the risk in people with nodules under 5 mm or 100 mm³ was similar to that of people without nodules (Larici et al., 2017).
The largest nodule is not always the problem
When there are several nodules, it is tempting to look only at the largest one. Fleischner, however, guides management by the most suspicious nodule, and for multiple nodules of 6 mm or more recommends CT in 3 to 6 months (Kapoor et al., 2020). In the Brock model, having more nodules reduced the probability of cancer for each one (McWilliams et al., 2013). The assessment must consider the characteristics of each nodule, not only the size.
Probability and management go together
Estimating the probability is not a theoretical exercise. It defines whether it is worth repeating the CT in three months, ordering PET/CT, indicating biopsy or discharging the patient. When the probability is low, additional tests can generate false positives: in nodules of 8 to 20 mm, PET had a false positive in 39 per 100 of the cases in which it was used (Tanner et al., 2015). When it is high, waiting too long can delay treatment. The text on clinical decision-making discusses this balance more broadly.
Fleischner: who it applies to and what it recommends
The Fleischner Society recommendations were made for incidental nodules in adults aged 35 or older, without known cancer and without immunosuppression (Schmid-Bindert et al., 2022). They do not apply to lung cancer screening, which has its own protocols, nor to oncology or immunosuppressed patients, in whom a nodule has another meaning.
How to measure
The guideline calls for measurement on thin slices. A review highlights the importance of slices of 1.5 mm or less, ideally 1.0 mm (Schmid-Bindert et al., 2022). The 2017 version of the guideline recommends using the average between the longest axis and the shortest axis, in the plane in which the nodule appears largest, and Fleischner also began to accept volume as a measurement (Larici et al., 2017).
The size thresholds
The threshold for indicating follow-up rose to 6 mm or 100 mm³ in Fleischner, supported by the NELSON data (Larici et al., 2017). For single solid nodules under 6 mm, the recommendation is not to do routine follow-up in low risk and, optionally, to repeat the CT in 12 months in high risk (Kapoor et al., 2020). Between 6 and 8 mm, CT is done in 6 to 12 months and then considered, in low risk, or done, in high risk, in 18 to 24 months (Kapoor et al., 2020). Above 8 mm, CT in 3 months, PET/CT or tissue sampling is considered (Kapoor et al., 2020).
In subsolid nodules, the reasoning changes. A single ground-glass nodule under 6 mm does not call for routine follow-up, and one of 6 mm or more calls for CT in 6 to 12 months to confirm persistence and then every 2 years for up to 5 years (Kapoor et al., 2020). In a partially solid nodule of 6 mm or more, CT is repeated in 3 to 6 months and, if it does not change and the solid part remains under 6 mm, annually for 5 years (Kapoor et al., 2020). The presence of a solid component corresponds to tumor invasion on pathology and predicts malignancy (Larici et al., 2017).
| Nodule type and size | Summary of Fleischner management | Note for the reasoning |
|---|---|---|
| Solid under 6 mm | No routine follow-up; optional CT at 12 months in high risk | Risk similar to that of someone without a nodule |
| Solid 6 to 8 mm | CT in 6 to 12 months and, as the case requires, in 18 to 24 months | Pretest probability guides the interval |
| Solid over 8 mm | CT in 3 months, PET/CT or biopsy | Use a risk model to decide the next step |
| Pure ground-glass of 6 mm or more | CT in 6 to 12 months and then every 2 years for up to 5 years | Growth is usually slow |
| Partially solid of 6 mm or more | CT in 3 to 6 months; annually for 5 years if the solid part is under 6 mm | Solid component predicts invasion |
The management in the table comes from the list of recommendations analyzed by Kapoor et al. (Kapoor et al., 2020), and the notes come from the reviews by Larici et al. (Larici et al., 2017). It serves as a starting point, not as a substitute for assessing the case.
Where the guideline leaves room for judgment
The Fleischner guideline asks the physician to decide between low and high risk, but does not impose a model. This gives flexibility and, at the same time, opens room for different interpretations. In a study with 9 physicians from the same service, the mean agreement with 18 recommendations of the guideline was 48.2 out of 100 (Kapoor et al., 2020). Only 22.2 out of 100 agreed with the recommendation not to follow nodules under 6 mm in low-risk patients, while 88.9 out of 100 agreed with the management for nodules of 8 mm or more (Kapoor et al., 2020).

Morphology: signs of benignity
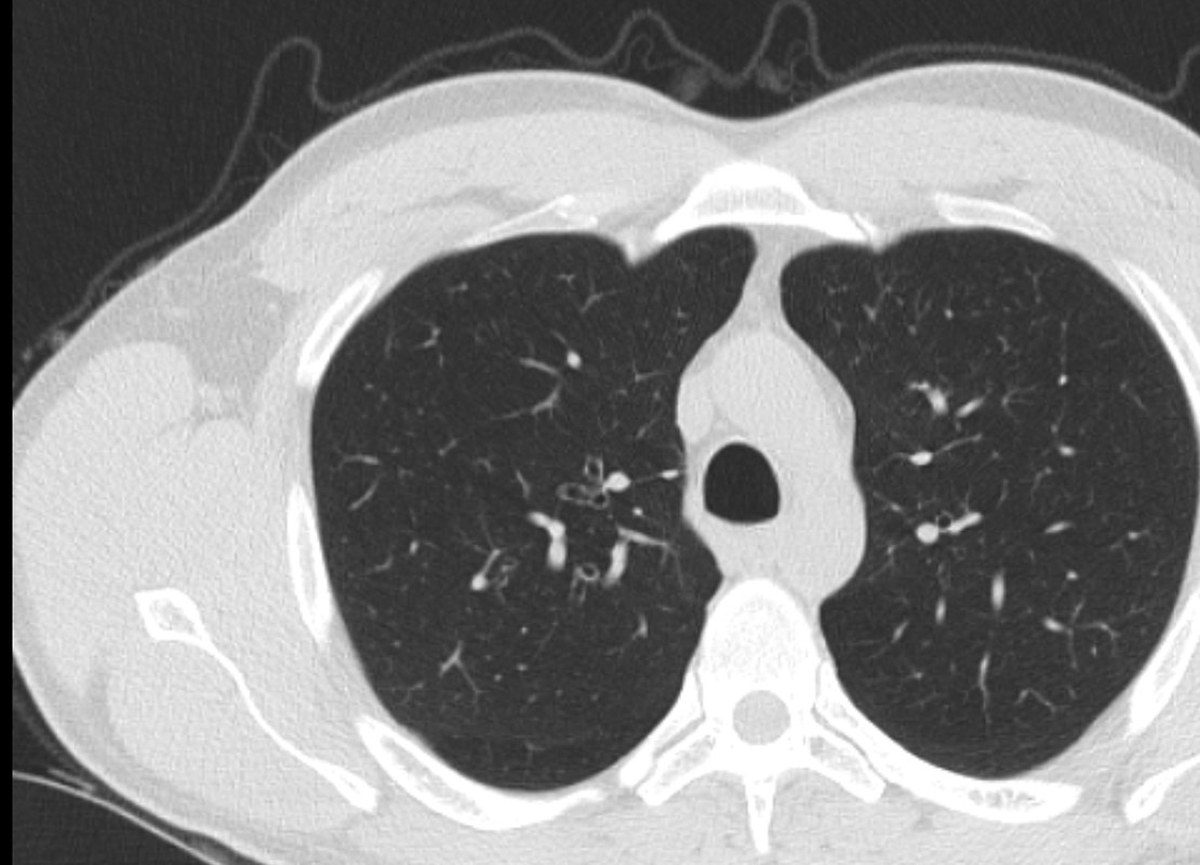
Before thinking about follow-up, it is worth looking carefully at the appearance of the nodule. Some patterns practically end the investigation, and others raise suspicion.
A review on the solitary nodule describes benign calcifications as central, diffusely solid or laminated, and popcorn calcification as typical of hamartoma (Snoeckx et al., 2018). Fat within the nodule is a reliable indicator of hamartoma, although only 50 out of 100 hamartomas have visible fat (Snoeckx et al., 2018). Even so, calcification alone does not guarantee benignity: it occurs in up to 13 out of 100 lung cancers, but in 2 out of 100 of those that present as a solitary nodule (Snoeckx et al., 2018). The pattern of calcification matters more than its simple presence.
Perifissural nodules, next to the fissures and often triangular, most often correspond to intrapulmonary lymph nodes (Snoeckx et al., 2018). When they are spiculated or cross the fissure, however, they should not be classified as benign and call for investigation (Snoeckx et al., 2018).
Morphology: signs of suspicion
Spiculation and upper lobe location entered the Brock model as risk factors (McWilliams et al., 2013). Location, however, did not behave the same way in all populations. In a Turkish study with 305 patients and high cancer prevalence, the upper lobe was not a reliable predictor (Susam et al., 2022).
The solid component in a subsolid nodule also raises suspicion. In the Brock model, partially solid nodules had more risk than solid ones (McWilliams et al., 2013). This observation helps explain why the Fleischner guideline pays special attention to the size of the solid part.

Measuring and tracking growth
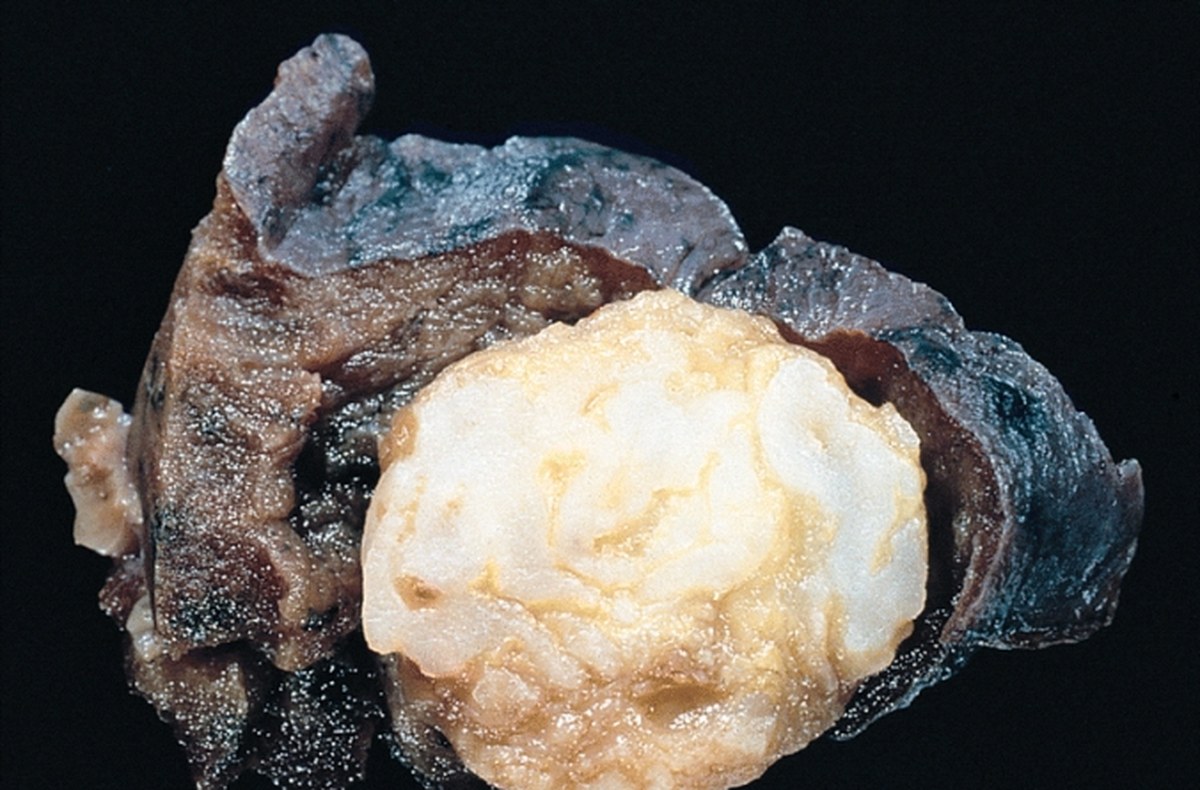
Growth is one of the best signs of malignancy, but measuring growth in structures of a few millimeters is harder than it seems.
Doubling time
Volume doubling time is the period a nodule takes to double in volume, which corresponds to an increase of 26 per 100 in diameter (Larici et al., 2017). This means a nodule can double in volume with a change in diameter that goes unnoticed by the naked eye.
In the NELSON study, growing nodules were divided into high risk, with doubling in less than 400 days, intermediate risk, between 400 and 600 days, and low risk, above 600 days (Larici et al., 2017). Growth, however, is not exclusive to cancer: intrapulmonary lymph nodes can grow with doubling times in the range of malignant nodules (Snoeckx et al., 2018). Doubling time enters the reasoning together with morphology and probability.
The measurement error
Repeated measurements of the same nodule vary. In a study with 45 adults and 100 nodules, the variation between two volume measurements had limits of agreement from minus 16.4 to 14.6 per 100 (Bartlett et al., 2022). The authors conclude that a variation of about 15 per 100 may already be real growth, below the 25 per 100 threshold used by the British guideline (Bartlett et al., 2022). A review on nodule measurements notes that the volume measurement error is between 20 and 25 per 100, which is why a change of 25 per 100 or more is used to define significant growth (Larici et al., 2017).
For the clinician, the message is practical: compare the current exam with all previous ones, preferably with the same technique, and be wary of conclusions based on differences of one or two millimeters.
When follow-up finds cancer
An Italian study followed 27 solid nodules of 250 mm³ or less (Borghesi et al., 2019). Five grew, which corresponds to 18.5 per 100, and all were malignant and were in high-risk patients (Borghesi et al., 2019). The authors calculated that applying Fleischner would have spared 2 CT scans without delaying these diagnoses (Borghesi et al., 2019).
Subsolid and ground-glass
Ground-glass and part-solid nodules have a natural history of their own. Many disappear, and those that persist tend to grow slowly.
In a large Korean screening program with 50,132 people, 6725 subsolid nodules were identified (Kim et al., 2021). The incidence was 10.7 per 100 in people who never smoked and 7.7 per 100 in smokers or former smokers (Kim et al., 2021). Of the nodules present on the initial exam, 30.0 per 100 disappeared, and of the new nodules, 78.9 per 100 disappeared (Kim et al., 2021).
New nodules had a lower chance of cancer, with an odds ratio of 0.26 (Kim et al., 2021). Among the 293 biopsied nodules, 227 were cancer, which corresponds to 77.5 per 100, and 99.6 per 100 of these cancers were adenocarcinomas (Kim et al., 2021). This finding explains why the guideline recommends repeating the exam before acting on new subsolid nodules.
In a study with 96 followed ground-glass opacities, 3 mixed opacities grew and no pure opacity grew (Lee et al., 2007). Among mixed opacities above 10 mm, most were adenocarcinoma, with 11 diagnoses of this type (Lee et al., 2007). The presence of a solid component therefore raises attention.
The long Fleischner follow-up for ground-glass, of up to 5 years, reflects this slow growth (Kapoor et al., 2020). Shortening this period without reason can lead to early discharge of lesions that will still grow.

Risk models: help, not an oracle
Prediction models try to turn patient and nodule characteristics into a number. They are useful for organizing reasoning, but each one was created in a specific population.
Brock (PanCan)
The Brock model was developed in the PanCan cohort and validated in the BCCA cohort, with an area under the curve above 0.90, including for nodules of 10 mm or less (McWilliams et al., 2013). In a German validation with 1159 participants and 3903 nodules, the PanCan model had an area under the curve of 0.93 to 0.94, the Mayo Clinic model 0.89 and the UKLS model 0.58 (González Maldonado et al., 2020). The review by Schmid-Bindert et al. cites the threshold of 10 per 100 in the Brock model used by the British guideline (Schmid-Bindert et al., 2022).
When the model loses strength
The good results come from screening populations, with low cancer prevalence. In a study with 305 referred patients and malignancy in 73 per 100, the areas under the curve were 0.71 for Mayo, 0.67 for Brock and 0.73 for Herder (Susam et al., 2022). The same model can work well in one setting and poorly in another.
This drop in performance reinforces a basic idea: the model answers the question it was trained for. In a patient already referred for high suspicion, the pre-test probability is different, and the model result must be read with care.
PET/CT and additional tests
A US multicenter study followed 377 patients with nodules of 8 to 20 mm, of which 25 per 100 were malignant (Tanner et al., 2015). Surveillance alone was the approach in 46 per 100, biopsy in 33.2 per 100 and surgery in 20.4 per 100 (Tanner et al., 2015). Among those operated on, 35 per 100 had benign disease, and PET had a false positive in 39 per 100 of the cases in which it was used (Tanner et al., 2015). Surgery rates were similar across risk groups, at 17, 21 and 17 per 100, which suggests that the estimated probability weighed little in the decision (Tanner et al., 2015).
The data expose the risk of investigating without an explicit probability estimate. The text on overdiagnosis discusses how tests beyond what is needed can cause harm.
From recommendation to practice
Knowing the guideline does not guarantee it will be followed. Studies on practice show failures in two directions: nodules without follow-up and nodules with too many tests.
Knowledge and use
In a survey with 119 radiologists and 243 pulmonologists, 93 per 100 of the radiologists and 70 per 100 of the pulmonologists knew Fleischner (Mets et al., 2016). Use in practice was 66 and 47 per 100, respectively, and excess follow-up was common (Mets et al., 2016). The review by Schmid-Bindert et al. cites that up to 42 per 100 of hospitalists do not know the guideline and that, even among radiologists, knowledge and use vary between 27 and 61 per 100 depending on the country (Schmid-Bindert et al., 2022).
Follow-up that does not happen
The most serious problem is the forgotten nodule. The review by Schmid-Bindert et al. describes follow-up rates of 29 to 39 per 100, although up to 68 per 100 of reports recommended follow-up (Schmid-Bindert et al., 2022). Systems for tracking findings increased follow-up from 46 to 55 per 100, and the RADAR system raised adherence from 65 to 84 per 100 (Schmid-Bindert et al., 2022).
In a study on RADAR, the system was used in 106 of 183 alerts for findings (Hammer et al., 2019). All alerts made by the system had an explicit recommendation, versus 71 per 100 of the others (Hammer et al., 2019). A clear report, with the type of test and the timeframe, makes life easier for the person receiving it.
Following the guideline makes a difference
In a cohort of 314 patients, 78.0 per 100 were managed according to the guidelines (Wayne et al., 2022). A composite outcome of management problems occurred in 6.1 per 100 of concordant cases and in 15.9 per 100 of those that deviated from the recommendation, and 14.3 per 100 of the nodules were malignant (Wayne et al., 2022). The difference suggests that the guideline, when applied, protects the patient.
The review by Schmid-Bindert and colleagues also compares screening programs: false positives in 1.2 per 100 in the NELSON study, which used volume and growth, against 23.3 per 100 in the NLST (Schmid-Bindert and colleagues, 2022). Clear protocols reduce unnecessary tests.
The patient's anxiety
For the patient, the nodule is a real concern. In a Chinese study, 59.3 per 100 of the people with nodules had anxiety, or 108 of 182 participants (Li and colleagues, 2020). Social support and a history of psychological illness were associated with anxiety (Li and colleagues, 2020). Explaining the probability, the plan and the timing of the next exam is part of the care.
Mistakes that repeat
- Applying Fleischner to patients with cancer, immunosuppression or age below 35 years, outside the population for which it was made (Schmid-Bindert and colleagues, 2022).
- Looking only at the largest nodule and forgetting the most suspicious one (Kapoor and colleagues, 2020).
- Reading small differences in measurement as growth (Bartlett and colleagues, 2022).
- Using a risk model created in screening for a patient already referred for high suspicion (Susam and colleagues, 2022).
- Discharging a ground-glass nodule before the follow-up deadline (Kapoor and colleagues, 2020).
- Leaving the report without a clear plan and without someone responsible for follow-up (Hammer and colleagues, 2019).
When the nodule proves suspicious, the decision on biopsy, surgery or another treatment benefits from group discussion, the topic of the text on lung cancer and the multidisciplinary team.
How NEXO helps train this reasoning
In NEXO, the case of the day is fictional, with a real clinical presentation and up to six progressive clues, and you propose the diagnosis by searching for the ICD-10 code.
The limits of using the game are described on the NEXO Economy page. If you research the teaching of clinical reasoning, the page for Researchers explains how to get in touch. Professionals who write or review cases find information on Curator and on Creators, and institutions can learn about the proposal on the partnerships page. Training differential diagnosis with clues and searching for the right ICD-10 code complete this practice.
Frequently asked questions
Does every pulmonary nodule need follow-up?
No. According to Fleischner, solid nodules below 6 mm in low-risk patients do not need routine follow-up, and in high-risk patients a CT scan at 12 months is optional (Kapoor and colleagues, 2020). In NELSON, the risk with nodules below 5 mm was similar to that of people who had no nodule (Larici and colleagues, 2017).
Who does Fleischner not apply to?
It does not apply to people under 35 years of age, with known cancer or with immunosuppression, nor to lung cancer screening (Schmid-Bindert and colleagues, 2022). In these cases, the meaning of the nodule and the approach are different.
How can you tell whether the patient is low or high risk?
Fleischner uses clinical factors such as age, smoking, exposure to inhaled carcinogens, emphysema or fibrosis and family history (Larici and colleagues, 2017). Size, spiculation and location complete the estimate, and models such as Brock's organize the calculation (McWilliams and colleagues, 2013).
The nodule grew. Is it cancer?
Not necessarily. Intrapulmonary lymph nodes can grow with a doubling time in the range of malignant ones (Snoeckx and colleagues, 2018). In addition, variation between measurements can mimic growth, which is why the British guideline uses 25 per 100 increase in volume as the threshold (Bartlett and colleagues, 2022).
Is ground glass always cancer?
No. In a large Korean program, 30.0 per 100 of initial subsolid nodules and 78.9 per 100 of new ones disappeared (Kim and colleagues, 2021). Those that persist and have a solid component deserve more attention (Lee and colleagues, 2007).
Take-home messages
- Most incidental nodules are benign, but the probability depends on the patient and on the nodule.
- Fleischner applies to adults aged 35 years or older, without cancer and without immunosuppression.
- Estimate the probability before applying the size table.
- Morphology, nodule type and doubling time change the approach, but none decides alone.
- Risk models lose performance in populations with high prevalence.
- Forgotten follow-up and too many tests are the two most common mistakes.
References
- Bartlett EC, Kemp SV, Rawal B, et al. Defining growth in small pulmonary nodules using volumetry: results from a "coffee-break" CT study and implications for current nodule management guidelines. Eur Radiol. 2022. PMID 34580748.
- Borghesi A, Michelini S, Nocivelli G, et al. Solid Indeterminate Pulmonary Nodules Less Than or Equal to 250 mm<sup>3</sup>: Application of the Updated Fleischner Society Guidelines in Clinical Practice. Radiol Res Pract. 2019. PMID 30719352.
- González Maldonado S, Delorme S, Hüsing A, et al. Evaluation of Prediction Models for Identifying Malignancy in Pulmonary Nodules Detected via Low-Dose Computed Tomography. JAMA Netw Open. 2020. PMID 32058555.
- Hammer MM, Kapoor N, Desai SP, et al. Adoption of a Closed-Loop Communication Tool to Establish and Execute a Collaborative Follow-Up Plan for Incidental Pulmonary Nodules. AJR Am J Roentgenol. 2019. PMID 30779667.
- Kapoor N, Lacson R, Hammer M, et al. Physician Agreement With Recommendations Contained in a National Guideline for the Management of Incidental Pulmonary Nodules: A Case Study. J Am Coll Radiol. 2020. PMID 32783898.
- Kim YW, Kwon BS, Lim SY, et al. Lung cancer probability and clinical outcomes of baseline and new subsolid nodules detected on low-dose CT screening. Thorax. 2021. PMID 33859050.
- Larici AR, Farchione A, Franchi P, et al. Lung nodules: size still matters. Eur Respir Rev. 2017. PMID 29263171.
- Lee HJ, Goo JM, Lee CH, et al. Nodular ground-glass opacities on thin-section CT: size change during follow-up and pathological results. Korean J Radiol. 2007. PMID 17277560.
- Li L, Zhao Y, Li H. Assessment of anxiety and depression in patients with incidental pulmonary nodules and analysis of its related impact factors. Thorac Cancer. 2020. PMID 32212379.
- McWilliams A, Tammemagi MC, Mayo JR, et al. Probability of cancer in pulmonary nodules detected on first screening CT. N Engl J Med. 2013. PMID 24004118.
- Mets OM, de Jong PA, Chung K, et al. Fleischner recommendations for the management of subsolid pulmonary nodules: high awareness but limited conformance - a survey study. Eur Radiol. 2016. PMID 26945759.
- Schmid-Bindert G, Vogel-Claussen J, Gütz S, et al. Incidental Pulmonary Nodules - What Do We Know in 2022. Respiration. 2022. PMID 36228594.
- Snoeckx A, Reyntiens P, Desbuquoit D, et al. Evaluation of the solitary pulmonary nodule: size matters, but do not ignore the power of morphology. Insights Imaging. 2018. PMID 29143191.
- Susam S, Çinkooğlu A, Ceylan KC, et al. Comparison of Brock University, Mayo Clinic and Herder models for pretest probability of cancer in solid pulmonary nodules. Clin Respir J. 2022. PMID 36207775.
- Tanner NT, Aggarwal J, Gould MK, et al. Management of Pulmonary Nodules by Community Pulmonologists: A Multicenter Observational Study. Chest. 2015. PMID 26087071.
- Wayne MT, Prescott HC, Arenberg DA. Prevalence and consequences of non-adherence to an evidence-based approach for incidental pulmonary nodules. PLoS One. 2022. PMID 36084105.