Pulmonary embolism: Wells, PERC and age-adjusted D-dimer
Table of contents
A 72-year-old woman arrives at the emergency department with shortness of breath for two days. She has no leg pain, has not coughed up blood, and her heart rate is slightly above normal. The on-call physician orders a D-dimer out of habit, the result comes back at 640 and, since it is above 500, she goes for CT angiography. The scan is normal. No one had asked beforehand what the clinical probability of embolism was, and no one remembered that, at 72, the cutoff could be different.
This script repeats in many emergency departments. Pulmonary embolism is serious, the symptoms are nonspecific, and the fear of missing it pushes toward imaging. The result is growing use of CT with low yield, contrast and radiation in people who did not need it, and small findings that may have no clinical importance.
This text reviews the sequence that organizes the reasoning: estimate the clinical probability, apply PERC when it is low, interpret the D-dimer with the right cutoff, including age adjustment and the YEARS strategy, and reserve imaging for those who truly need it.
Key points
- The first step is always clinical probability, by structured judgment or by a score such as Wells.
- With low probability and all eight PERC criteria negative, there is no need to order even the D-dimer.
- With high probability, the path is direct imaging, without D-dimer.
- Above 50 years of age, the age-adjusted D-dimer cutoff increases specificity without losing relevant sensitivity.
- YEARS and PEGeD use D-dimer cutoffs that vary with clinical probability and reduce the need for imaging.
- CT angiography remains the test of choice when imaging is indicated.
Why pulmonary embolism is hard to diagnose
The symptoms and signs of pulmonary embolism are nonspecific, and the diagnosis is sometimes very difficult (Glazier et al., 2024). Symptoms include shortness of breath, chest pain, presyncope or syncope, and hemoptysis (Glazier et al., 2024). In the PIOPED II analysis cited by Glazier, shortness of breath was the most frequent symptom in patients without prior cardiopulmonary disease, present in 73 out of 100 (Glazier et al., 2024). Hemoptysis appears in about 14 out of 100, and syncope or presyncope in fewer than 10 out of 100 (Glazier et al., 2024).
The disease also has a clear age profile. Incidence doubles every decade after age 40 (Jarman et al., 2021). Between 20 and 40 years, women develop embolism at a rate that is roughly double that of men (Jarman et al., 2021).
Bedside tests help little
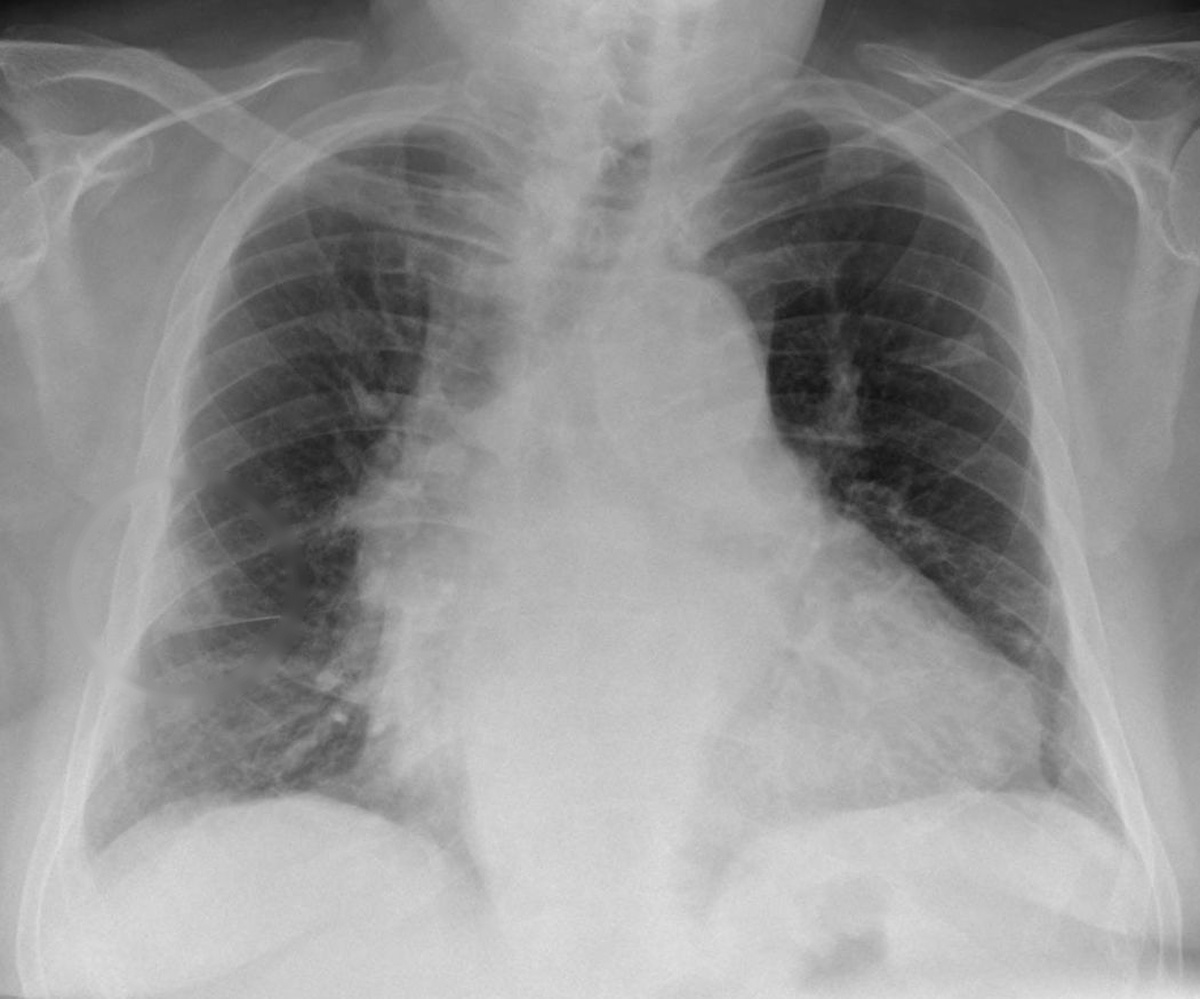
Arterial blood gas does not seem especially useful in diagnosis (Glazier et al., 2024). In a large clinical study cited in the review, 42 out of 100 patients with embolism had no hypoxemia (Glazier et al., 2024). Chest radiography serves mainly to exclude diagnoses that mimic embolism, such as heart failure or pneumonia (Glazier et al., 2024). In 2322 patients with confirmed embolism, radiography was normal in 24 out of 100 (Glazier et al., 2024). The classic radiologic signs, such as Hampton hump, Fleischner sign and Westermark sign, were poor predictors (Glazier et al., 2024).
The electrocardiogram has low sensitivity and limited value for diagnosis (Glazier et al., 2024). The most common change is sinus tachycardia, present in about 30 out of 100, and the S1Q3T3 pattern appears in only 4 out of 100 (Glazier et al., 2024). Its main role is to detect other serious diseases, such as acute myocardial infarction (Glazier et al., 2024).

Clinical probability: the first step
After the history, the examination and the initial tests, three steps follow: estimate the clinical probability in every patient, measure D-dimer when indicated and perform imaging when indicated (Glazier and colleagues, 2024). Probability is classified as low, moderate or high, with embolism prevalence below 15 in 100, from 15 to 40 in 100 and above 40 in 100, respectively (Glazier and colleagues, 2024). This is the same reasoning as pretest probability applied to a disease where erring in either direction is costly.
Clinical judgment and scores
The clinical judgment of experienced physicians, the so-called gestalt, was non-inferior to standardized scores such as Wells and Geneva (Glazier and colleagues, 2024). The scores are still recommended as support for selecting who needs more tests (Glazier and colleagues, 2024). Wells and revised Geneva have been extensively validated and showed comparable predictive accuracy when applied in the same population (Glazier and colleagues, 2024).
The Wells score
The Wells score adds points for objective characteristics and for one subjective question: whether embolism is the most likely diagnosis (Corrigan and colleagues, 2016). In the table reproduced by Glazier, clinical signs of deep vein thrombosis are worth 3 points, as is embolism being more likely than an alternative diagnosis (Glazier and colleagues, 2024). Heart rate above 100, immobilization or surgery in the previous 4 weeks and previous embolism or thrombosis are worth 1.5 points each; hemoptysis and cancer in the last 6 months are worth 1 point each (Glazier and colleagues, 2024).
With fewer than 2 points, probability is low; from 2 to 6, intermediate; above 6, high (Corrigan and colleagues, 2016). In the dichotomous form, up to 4 points indicate unlikely embolism and above 4, likely (Corrigan and colleagues, 2016). In this modified version, embolism prevalence was 3 in 100 in the unlikely group and 28 in 100 in the likely group (Glazier and colleagues, 2024).
The weight of the subjective question is the score's strength and weakness. Three points depend on the physician believing that no other diagnosis better explains the picture (Glazier and colleagues, 2024). The revised Geneva score does not use this subjective judgment and includes items such as age above 65 years, previous thrombosis or embolism and tachycardia (Glazier and colleagues, 2024).
When probability is high
The high-probability criteria include gestalt above 40 in 100, Wells above 6 or Geneva above 10 (Glazier and colleagues, 2024). In these patients, the high prevalence reduces the negative predictive value of D-dimer and increases the risk of diagnostic failure (Glazier and colleagues, 2024). They should therefore go straight to chest imaging, without measuring D-dimer (Glazier and colleagues, 2024).
PERC: when even D-dimer is unnecessary
PERC was designed to identify patients in whom the risk of testing outweighs the benefit, with a testing threshold calculated at 2 in 100 prevalence (Corrigan and colleagues, 2016). The rule has eight objective variables and applies only to patients with low clinical probability (Corrigan and colleagues, 2016).
The eight criteria
PERC is negative when all of these items are absent: age above 49 years, pulse above 99 per minute, oxygen saturation on room air below 95 in 100, unilateral leg swelling, hemoptysis, recent trauma or surgery, previous embolism or thrombosis and hormone use (Glazier and colleagues, 2024). With low implicit probability, below 15 in 100, and a PERC of zero, the negative predictive value exceeds 98.5 in 100 (Glazier and colleagues, 2024).
The rule's sensitivity is between 96 and 100 in 100, but specificity is between 15 and 27 in 100 (Corrigan and colleagues, 2016). In a multicenter validation study with 8138 patients, 1666 had low probability and a negative PERC, and 15 of them had venous thromboembolism within 45 days, a false-negative rate below 1 in 100 (Corrigan and colleagues, 2016).
What PROPER showed
The PROPER trial tested PERC at 14 centers in France between 2015 and 2016, including patients with a clinical probability below 15 in 100 by the physician's judgment (Glazier et al., 2024). The false-negative rate was only 1 in 100, and use of PERC was associated with a reduction of 8 in 100 in unnecessary CT scans (Glazier et al., 2024).
The PERC derivation and validation cohorts had about two thirds women, and sex was assessed but did not enter the rule because it was not significant (Jarman et al., 2021). The criteria apply to the patient with low probability. Applied to those with intermediate probability, they are not enough and D-dimer remains necessary (Jarman et al., 2021).
D-dimer: a rule-out test
D-dimer is a product of fibrin degradation by endogenous fibrinolysis, and the test is very sensitive for acute thrombosis (Glazier et al., 2024). Traditionally, values from 500 ng/mL are considered abnormal, and the sensitivity of current assays is around 95 in 100 (Glazier et al., 2024). A negative D-dimer rules out embolism with a post-test probability below 2 in 100 in patients without high probability (Corrigan et al., 2016).
The specificity problem
Specificity, however, is low, typically 40 to 50 in 100, and many patients with a positive test need further exams (Corrigan et al., 2016). D-dimer often rises in people over 80, pregnant women, especially in the third trimester, people with sickle cell disease and those who had trauma or major surgery in the past month (Corrigan et al., 2016).
Age weighs heavily. Up to 40 years, specificity is around 67 in 100; from 80 onward, it falls to 10 in 100, with a large proportion of false positives (Glazier et al., 2024). Before the adjustment, the test could rule out embolism in 60 in 100 of patients under 40, but in only 5 in 100 of those over 80 (Douma et al., 2010).

Age-adjusted D-dimer and YEARS
Where the age cutoff came from
Douma et al. defined the new cutoff as age multiplied by 10, in µg/L, for patients over 50 (Douma et al., 2010). In 1331 patients with an unlikely score, embolism could be ruled out in 42 in 100 with the new cutoff, versus 36 in 100 with the old cutoff (Douma et al., 2010). The absolute gain was greater above 70 years, between 13 and 16 in 100 across the three data sets (Douma et al., 2010). Failure rates were 0.2 in 100 in the derivation and 0.6 and 0.3 in 100 in the two validations (Douma et al., 2010).
A meta-analysis of 13 cohorts with 12,497 patients without high probability confirmed the effect (Schouten et al., 2013). With the conventional cutoff, specificity fell from 57.6 in 100 between 51 and 60 years to 14.7 in 100 above 80 (Schouten et al., 2013). With the adjusted cutoff, it was 62.3 and 35.2 in 100 in the same age bands, and sensitivity stayed above 97 in 100 in all of them (Schouten et al., 2013).
ADJUST-PE
In ADJUST-PE, the cutoff was 500 ng/mL up to 50 years and age multiplied by 10 above that (Glazier et al., 2024). Above 50 years, the embolism rate among patients with D-dimer above 500 but below the adjusted cutoff was only 0.3 in 100 (Glazier et al., 2024). The adjustment was associated with a calculated absolute reduction of 23 in 100 in imaging exams (Glazier et al., 2024).
In the patient from the opening scene, aged 72, the adjusted cutoff would be 720. A D-dimer of 640 would fall below it, and, if the clinical probability were not high, embolism could be ruled out without a CT scan, as this type of strategy provides (Glazier et al., 2024).
YEARS and PEGeD
YEARS uses three items from the Wells score: clinical signs of deep vein thrombosis, hemoptysis and pulmonary embolism as the most likely diagnosis (Glazier et al., 2024). With no items, the D-dimer cutoff is 1000 ng/mL; with one or more, it is 500 ng/mL (Glazier et al., 2024). Applied to 3465 patients, the algorithm left 2946 untreated, and 18 of them, 0.6 per 100, had symptomatic thromboembolism within 3 months (Glazier et al., 2024). Compared with Wells, YEARS reduced CT pulmonary angiograms by 14 per 100 in absolute terms (Glazier et al., 2024).
PEGeD defined low probability as a Wells score of 0 to 4.0 and excluded from imaging those who had this probability and a D-dimer below 1000 ng/mL (Glazier et al., 2024). The algorithm had a missed diagnosis rate of 0.05 per 100 and reduced imaging from 52 to 34 per 100 (Glazier et al., 2024).
The table summarizes the cutoffs of each strategy.
| Strategy | For whom | Rule for excluding imaging |
|---|---|---|
| PERC | Low probability, below 15 per 100 | All eight criteria absent, no D-dimer (Glazier et al., 2024) |
| Conventional D-dimer | Not high probability | Below 500 ng/mL (Glazier et al., 2024) |
| Age adjustment | Over 50 years, not high probability | Below age times 10 (Douma et al., 2010) |
| YEARS | Suspected pulmonary embolism | Zero items and below 1000, or one item or more and below 500 (Glazier et al., 2024) |
| PEGeD | Wells of 0 to 4.0 (Glazier et al., 2024) | Below 1000 ng/mL (Glazier et al., 2024) |
| High probability | Wells above 6 or gestalt above 40 per 100 | None; direct imaging (Glazier et al., 2024) |
Imaging, pregnancy and common errors
CT pulmonary angiography as the standard
CT pulmonary angiography is the modality of choice for diagnosing acute pulmonary embolism (Glazier et al., 2024). A recent meta-analysis cited by Glazier reported sensitivity of 94 per 100 and specificity of 98 per 100 (Glazier et al., 2024). The exam can also show other causes for the symptoms, such as pneumonia, rib fractures and pneumothorax (Glazier et al., 2024). The PERT consensus recommends using CT pulmonary angiography when probability is low or intermediate with a positive D-dimer, or when it is high (Rivera-Lebron et al., 2019).
The cost of ordering too much
CT pulmonary angiography exposes the patient to radiation and contrast (Corrigan et al., 2016). In seven United States health systems, with 52,343,517 person-years of follow-up, the use of CT pulmonary angiography for suspected pulmonary embolism grew 450 per 100 between 2004 and 2016 (Wang et al., 2020). In the same period, the use of ventilation-perfusion scintigraphy fell 47.1 per 100 (Wang et al., 2020). The authors concluded that efforts against overuse were not fully successful (Wang et al., 2020).
At one academic center, 268 of 4048 emergency department CT pulmonary angiograms, 6.6 per 100, were positive for acute pulmonary embolism (Schissler et al., 2013). Use rose without a corresponding change in diagnostic yield, and the chance of diagnosing less severe pulmonary embolisms increased, without right ventricular dysfunction or myocardial injury (Schissler et al., 2013). More sensitive exams detect ever smaller emboli, potentially without clinical significance (Jarman et al., 2021), which is the scenario of overdiagnosis.

Alternatives to tomography
When there is a contraindication to CT angiography, such as advanced kidney disease or contrast allergy, ventilation-perfusion scintigraphy is an alternative (Glazier et al., 2024). Its radiation dose to the breast is 50 times lower than that of 64-slice CT and it can be considered in young women, including pregnant women (Glazier et al., 2024). The European nuclear medicine guideline states that ventilation-perfusion SPECT has no contraindications and establishes the diagnosis even in the presence of COPD, heart failure or pneumonia (Bajc et al., 2019). The PERT consensus suggests considering echocardiography or portable scintigraphy when CT angiography is not possible (Rivera-Lebron et al., 2019).
Pregnancy
In pregnancy, the need to avoid excessive radiation has made ventilation-perfusion scintigraphy the preferred test for evaluating embolism (Patel et al., 2020). A meta-analysis of four studies found 1 event in 312 untreated pregnant women after a negative D-dimer, 0.32 per 100 (Bellesini et al., 2021). The pooled sensitivity was 99.5 per 100 and the negative predictive value was 100 per 100 (Bellesini et al., 2021). The test yield, the proportion with a negative D-dimer, was 34.2 per 100 (Bellesini et al., 2021). In one of the studies, the proportion of negative results fell from 25 to 11 and 4 per 100 from the first to the third trimester (Bellesini et al., 2021).
Mistakes that repeat
- Ordering a D-dimer without estimating clinical probability, which reverses the logic of the exclusion test (Glazier et al., 2024).
- Measuring D-dimer when probability is high, a situation in which imaging should come directly (Glazier et al., 2024).
- Applying PERC to someone who does not have low probability (Corrigan et al., 2016).
- Using the 500 cutoff in patients over 50 and sending to CT those who would be below the age-adjusted cutoff (Douma et al., 2010).
- Relying on normal blood gas or a normal chest X-ray to rule out embolism (Glazier et al., 2024).
Each of these steps is a decision about tests that should depend on the clinical question, not on habit.
How NEXO helps train this reasoning
In NEXO, the case of the day is fictional, with a real clinical presentation and up to six progressive clues, and you propose the diagnosis by searching for the code in ICD-10.
The limits of use of the game are described on the NEXO economy page. If you research the teaching of clinical reasoning, the page for researchers explains how to get in touch. Professionals who write or review cases find information under curation and creators, and institutions can learn about the proposal on the partnerships page. Training differential diagnosis with clues and searching for the right code in ICD-10 complete this practice.
Frequently asked questions
Can I use PERC in any patient with suspected embolism?
No. PERC applies only to patients with low clinical probability (Corrigan et al., 2016). With intermediate probability or a positive PERC, the next step is the D-dimer (Jarman et al., 2021).
Is age-adjusted D-dimer safe?
In the derivation and validation studies, failure rates ranged from 0.2 to 0.6 per 100 (Douma et al., 2010). In the meta-analysis, the sensitivity of the adjusted cutoff remained above 97 per 100 in all age groups (Schouten et al., 2013).
What is the difference between YEARS and age adjustment?
YEARS changes the cutoff according to the presence of three clinical items; age adjustment changes the cutoff according to age (Glazier et al., 2024). In YEARS, only 0.6 per 100 of the patients left untreated had thromboembolism within 3 months (Glazier et al., 2024). Glazier sums up the lesson of both: with low probability, a D-dimer below 1000 ng/mL rules out without imaging; without low probability, the age-adjusted cutoff applies (Glazier et al., 2024).
When to skip the D-dimer and go straight to CT?
When clinical probability is high, because in that situation the negative predictive value of the D-dimer falls (Glazier et al., 2024).
Is D-dimer useful in pregnancy?
A meta-analysis suggests that it can safely rule out thromboembolism in pregnant women with low or intermediate probability, but the yield falls over the course of pregnancy (Bellesini and colleagues, 2021).
Take-home messages
- Estimate the clinical probability before ordering any test.
- A negative PERC with low probability rules out the need for D-dimer.
- High probability goes straight to imaging.
- Above 50 years of age, use the age-adjusted D-dimer cut-off.
- YEARS and PEGeD safely reduce imaging in the studies.
- CT angiography is the standard when indicated, but ordering too many has a cost.
References
- Bajc M, Schümichen C, Grüning T, et al. EANM guideline for ventilation/perfusion single-photon emission computed tomography (SPECT) for diagnosis of pulmonary embolism and beyond. Eur J Nucl Med Mol Imaging. 2019. PMID 31410539.
- Bellesini M, Robert-Ebadi H, Combescure C, et al. D-dimer to rule out venous thromboembolism during pregnancy: A systematic review and meta-analysis. J Thromb Haemost. 2021. PMID 34161671.
- Corrigan D, Prucnal C, Kabrhel C. Pulmonary embolism: the diagnosis, risk-stratification, treatment and disposition of emergency department patients. Clin Exp Emerg Med. 2016. PMID 27752629.
- Douma RA, le Gal G, Söhne M, et al. Potential of an age adjusted D-dimer cut-off value to improve the exclusion of pulmonary embolism in older patients: a retrospective analysis of three large cohorts. BMJ. 2010. PMID 20354012.
- Glazier MM, Glazier JJ. Diagnostic Strategies in Pulmonary Embolism. Int J Angiol. 2024. PMID 38846998.
- Jarman AF, Mumma BE, Singh KS, et al. Crucial considerations: Sex differences in the epidemiology, diagnosis, treatment, and outcomes of acute pulmonary embolism in non-pregnant adult patients. J Am Coll Emerg Physicians Open. 2021. PMID 33532761.
- Patel H, Sun H, Hussain AN, et al. Advances in the Diagnosis of Venous Thromboembolism: A Literature Review. Diagnostics (Basel). 2020. PMID 32498355.
- Rivera-Lebron B, McDaniel M, Ahrar K, et al. Diagnosis, Treatment and Follow Up of Acute Pulmonary Embolism: Consensus Practice from the PERT Consortium. Clin Appl Thromb Hemost. 2019. PMID 31185730.
- Schissler AJ, Rozenshtein A, Kulon ME, et al. CT pulmonary angiography: increasingly diagnosing less severe pulmonary emboli. PLoS One. 2013. PMID 23776522.
- Schouten HJ, Geersing GJ, Koek HL, et al. Diagnostic accuracy of conventional or age adjusted D-dimer cut-off values in older patients with suspected venous thromboembolism: systematic review and meta-analysis. BMJ. 2013. PMID 23645857.
- Wang RC, Miglioretti DL, Marlow EC, et al. Trends in Imaging for Suspected Pulmonary Embolism Across US Health Care Systems, 2004 to 2016. JAMA Netw Open. 2020. PMID 33216141.